A previous post Light Bulbs Disprove Global Warming presented an article by Dr. Peter Ward along with some scientific discussion from his website. This post presents an excerpt from Chapter One of his book which helpfully explains his journey of discovery from his field of volcanism to the larger question of global warming.
The Chapter is How I Came to Wonder about Climate Change. Excerpts in italics with my bolds.
Discovering a More Likely Cause of Global Warming
The evidence for volcanism in the ice layers under Summit, Greenland, consists of sulfate
deposits. Sulfate comes from sulfur dioxide, megatons of which are emitted during each
volcanic eruption. At first, I thought that the warming was caused by the sulfur dioxide,
which is observed to absorb solar energy passing through the atmosphere.17 My thinking
was influenced by greenhouse warming theory, which assumes that carbon dioxide causes
global warming because it is observed to absorb infrared energy radiated by Earth as it
passes upward through the atmosphere and is then thought to re-radiate it back down to
the surface, thus causing warming. The sulfur dioxide story, however, just wasn’t adding
up quantitatively.

Figure 1.9 Average temperatures per century (black) increased at the same time as the amount of volcanic sulfate per century (red). The greatest warming occurred when volcanism was more continuous from year to year, as shown by the blue circles surrounding the number of contiguous layers (7 or more) containing volcanic sulfate. It was this continuity over two millennia that finally warmed the world out of the last ice age. Data are from the GISP2 drill hole under Summit, Greenland. Periods of major warming are labeled in black. Periods of major cooling are labeled in blue.
Eventually, after publishing two papers that developed this story, I came to realize
that sulfur dioxide was actually just the “footprint” of volcanism—a measure of how
active volcanoes were at any given time. The real breakthrough came when I came across
a paper reporting that the lowest concentrations of stratospheric ozone ever recorded were for the two years after the 1991 eruption of Mt. Pinatubo, the largest volcanic eruption since the 1912 eruption of Mt. Katmai. As I dug deeper, analyzing ozone records from Arosa, Switzerland18—the longest running observations of ozone in the world, begun in 1927 (Figure 8.15 on page 119)—I found that ozone spiked in the years of most volcanic eruptions but dropped dramatically and precipitously in the year following each eruption. There seemed to be a close relationship between volcanism and ozone. What could that relationship be?
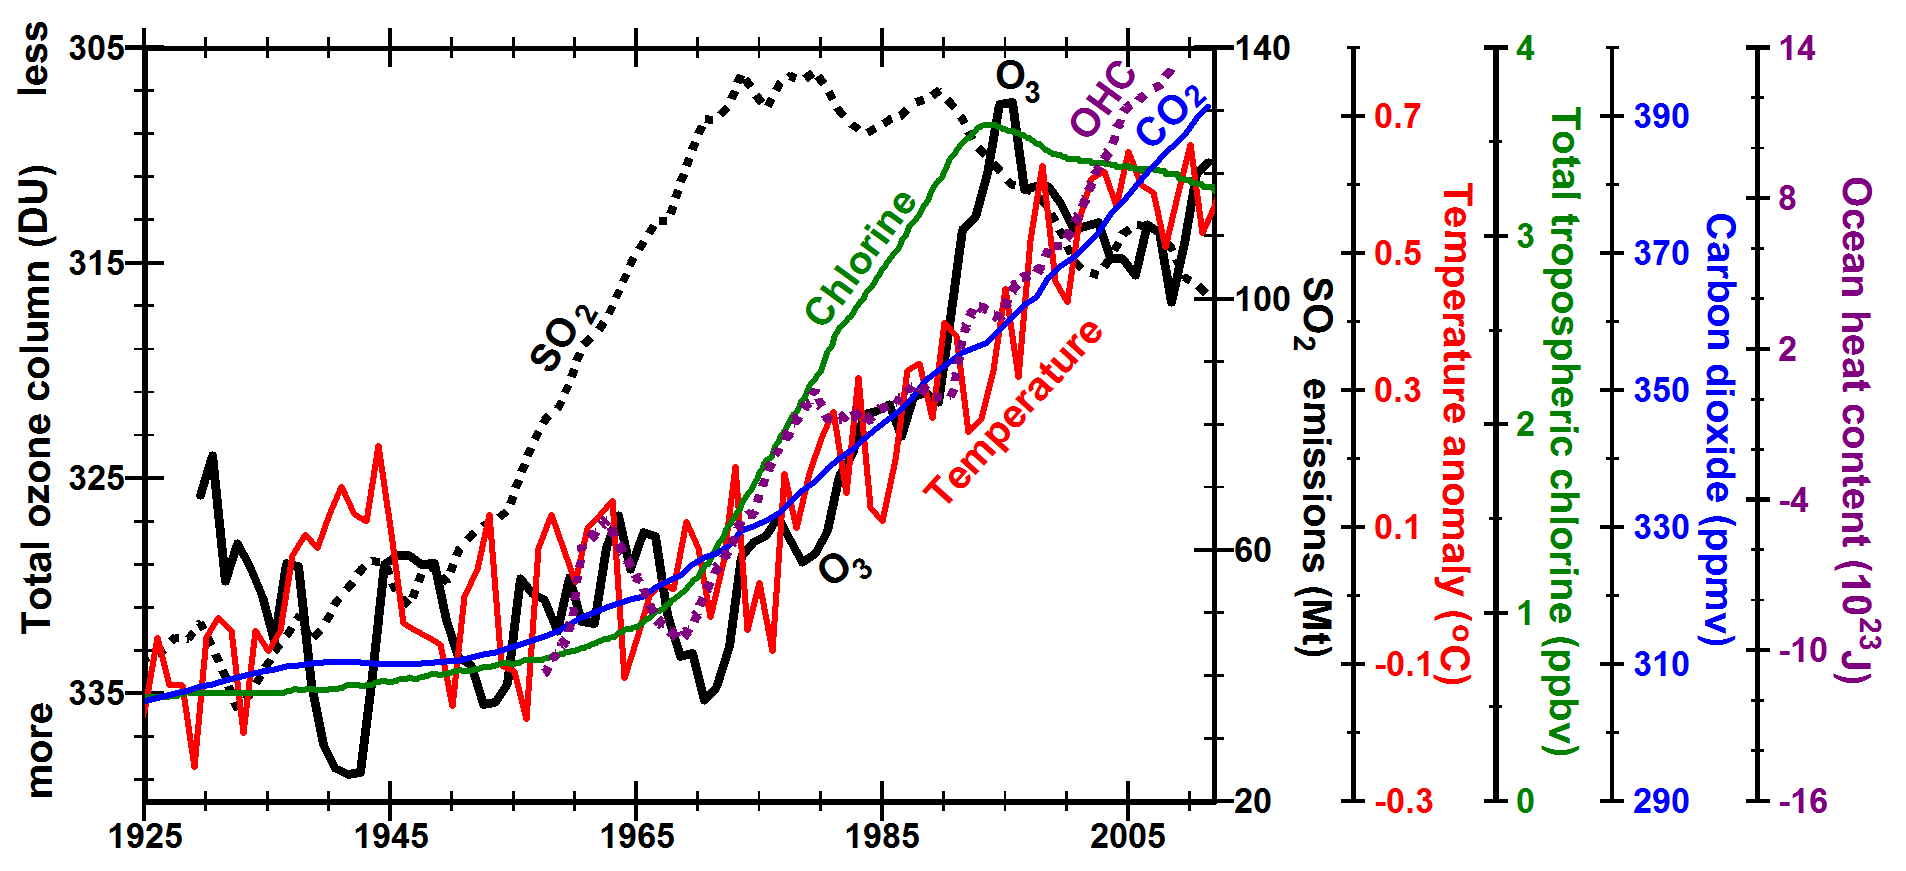
Increased SO2 pollution (dotted black line) does not appear to contribute to substantial global warming (red line) until total column ozone decreased (black line, y-axis inverted), most likely due to increasing tropospheric chlorine (green line). Mean annual temperature anomaly in the Northern Hemisphere (red line) and ozone (black line) are smoothed with a centered 5 point running mean. OHC is ocean heat content (dotted purple line).
The answer was not long in coming. I knew that all volcanoes release hydrogen chloride
when they erupt, and I also knew that chlorine from man-made chlorofluorocarbon
compounds had been identified in the 1970s as a potent agent of stratospheric ozone
depletion. From these two facts, and a third one, I deduced that it must be the depletion of
ozone by chlorine in volcanic hydrogen chloride—and not the absorption of solar radiation
by sulfur dioxide—that was driving the warming events that followed volcanic eruptions.
The third fact in the equation was the well-known interaction of stratospheric ozone with
solar radiation.
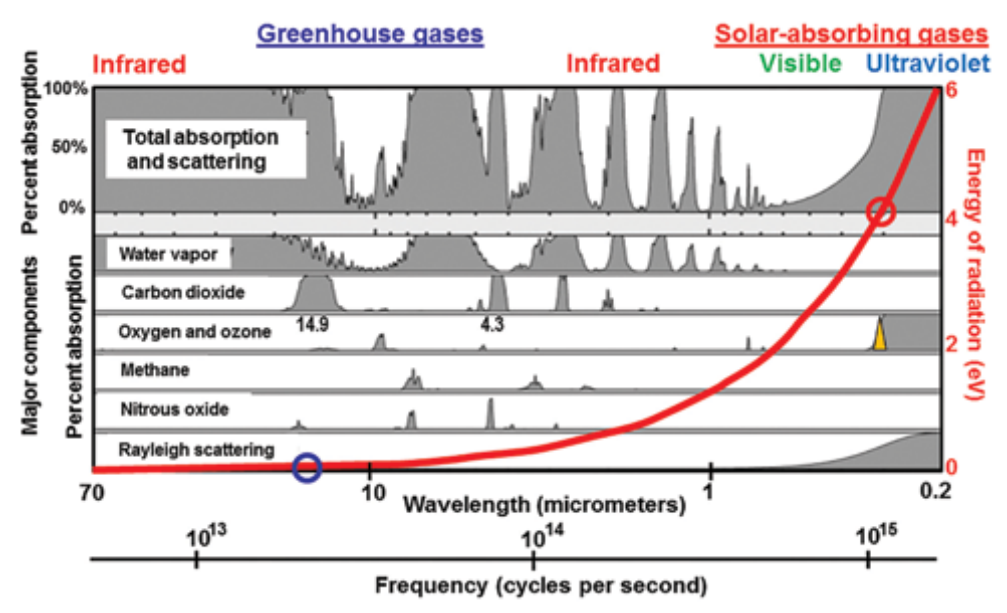
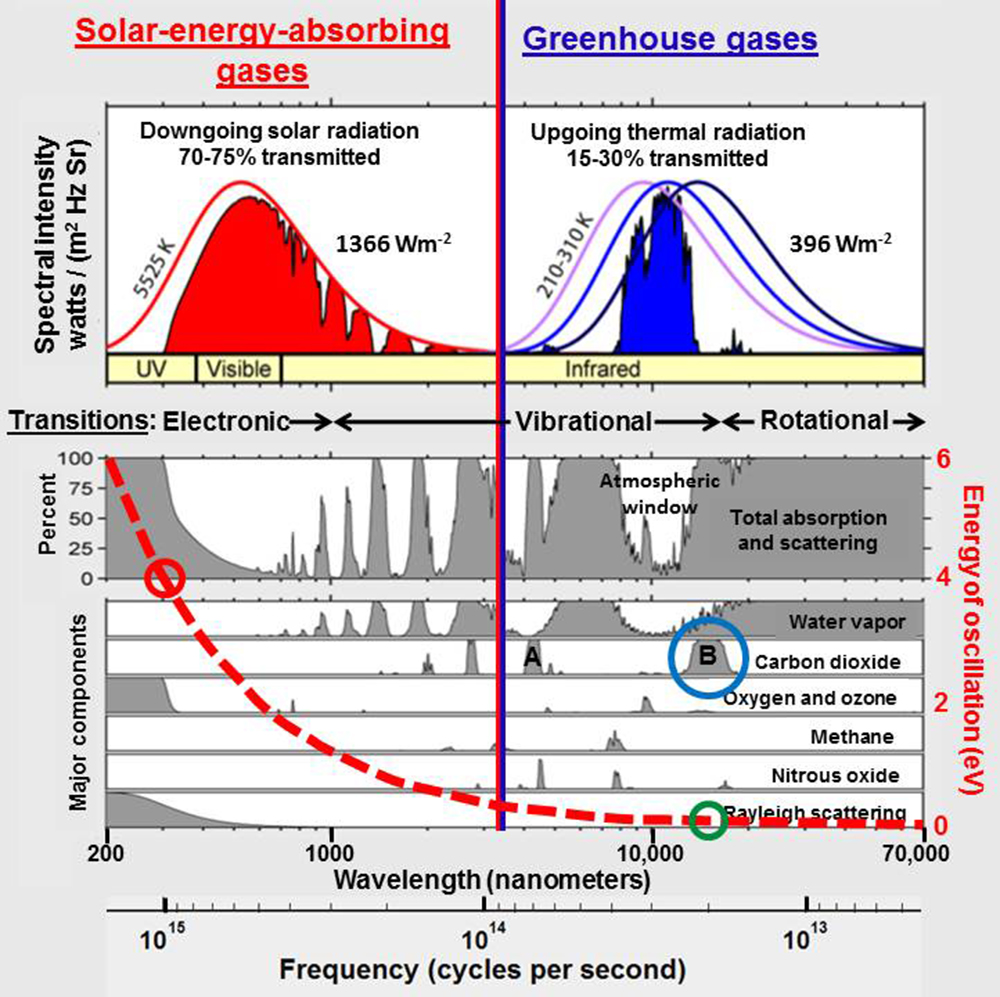
Figure 1.10 When ozone is depleted, a narrow sliver of solar ultraviolet-B radiation with wavelengths close to 0.31 µm (yellow triangle) reaches Earth. The red circle shows that the energy of this ultraviolet radiation is around 4 electron volts (eV) on the red scale on the right, 48 times the energy absorbed most strongly by carbon dioxide (blue circle, 0.083 eV at 14.9 micrometers (µm) wavelength. Shaded grey areas show the bandwidths of absorption by different greenhouse gases. Current computer models calculate radiative forcing by adding up the areas under the broadened spectral lines that make up these bandwidths. Net radiative energy, however, is proportional to frequency only (red line), not to amplitude, bandwidth, or amount.
The ozone layer, at altitudes of 12 to 19 miles (20 to 30 km) up in the lower
stratosphere, absorbs very energetic solar ultraviolet radiation, thereby protecting life on
Earth from this very “hot,” DNA-destroying radiation. When the concentration of ozone is
reduced, more ultraviolet radiation is observed to reach Earth’s surface, increasing the risk
of sunburn and skin cancer. There is no disagreement among climate scientists about this,
but I went one step further by deducing that this increased influx of “super-hot” ultraviolet
radiation also actually warms Earth.
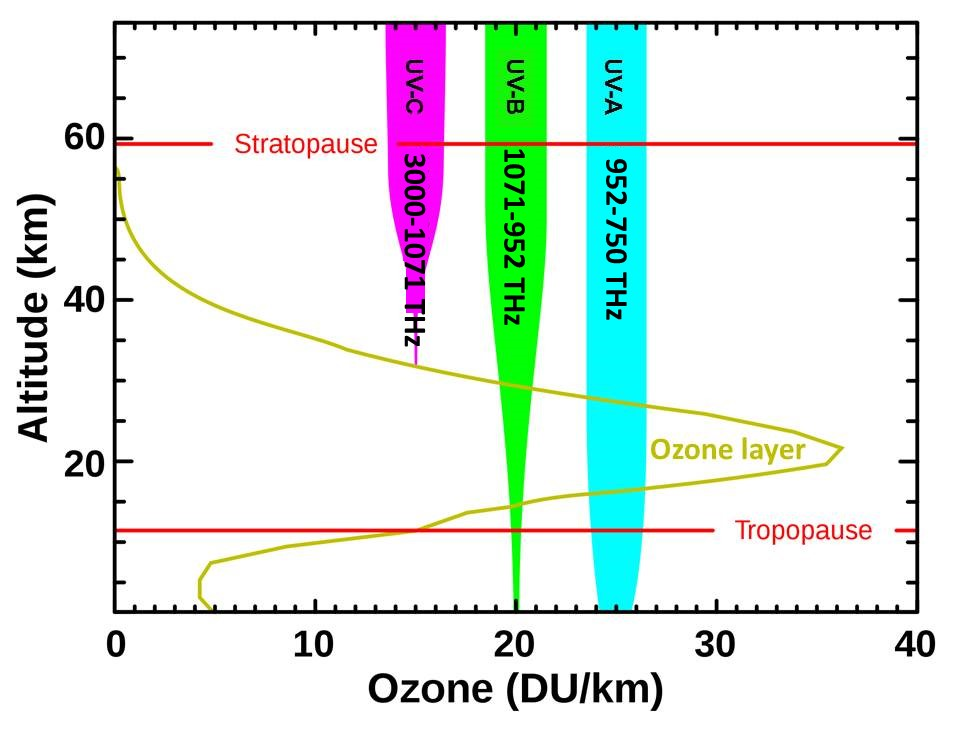
All ultraviolet UV-C is absorbed in the upper atmosphere. Most UV-B is absorbed in the stratosphere. The wavelengths of UV are shown in nanometers.
All current climate models assume that radiation travels through space as waves and
that energy in radiation is proportional to the square of the amplitude of these waves
and to the bandwidth of the radiation, i.e. to the range of wavelengths or frequencies
involved. Figure 1.10 shows the percent absorption for different greenhouse-gases as a
function of wavelength or frequency. It is generally assumed that the energy absorbed
by greenhouse-gases is proportional to the areas shaded in gray. From this perspective,
absorption by carbon dioxide of wavelengths around 14.9 and 4.3 micrometers in
the infrared looks much more important than absorption by ozone of ultraviolet-B
radiation around 0.31 micrometers. Climate models thus calculate that ultraviolet
radiation is relatively unimportant for global warming because it occupies a rather
narrow bandwidth in the solar spectrum compared to Earth’s much lower frequency,
infrared radiation.
The models neglect the fact, shown by the red line in Figure 1.10 and explained in
Chapter 4, that due to its higher frequency, ultraviolet radiation (red circle) is
48 times more energy-rich, 48 times “hotter,” than infrared absorbed by
carbon dioxide (blue circle), which means that there is a great deal more energy packed
into that narrow sliver of ultraviolet (yellow triangle) than there is in the broad band
of infrared. This actually makes very good intuitive sense. From personal experience,
we all know that we get very hot and are easily sunburned when standing in ultraviolet
sunlight during the day, but that we have trouble keeping warm at night when standing
in infrared energy rising from Earth.
These flawed assumptions in the climate models are based on equations that were
written in 1865 by James Clerk Maxwell and have been used very successfully to design
every piece of electronics that we depend on today, including our electric grid. Maxwell
assumed that electromagnetic energy travels as waves through matter, air, and space.
His wave equations seem to work well in matter, but not in space. Even though Albert
Michelson and Edward Morley demonstrated experimentally in 1887 that there is no
medium in space, no so-called luminiferous aether, through which waves could travel,
most physicists and climatologists today still assume that electromagnetic radiation does
in fact travel through space at least partially in the form of waves.
They also erroneously assume that energy in these imagined waves is proportional to
the square of their amplitude, which is true in matter, but cannot be true in space. They
calculate that there is more energy in the broad band of low-frequency infrared radiation
emitted by Earth and absorbed by greenhouse gases than there is in the narrow sliver of
additional high-frequency ultraviolet solar radiation that reaches Earth when ozone is
depleted (Figure 1.10). Nothing could be further from the truth.
The energy of radiation absorbed by carbon dioxide around 14,900 nanometers (blue circle) is near 0.08 electron volts (green circle) while the energy that reaches Earth when the ozone layer is depleted around 310 nanometers (red circle) is near 4 electron volts, 48 times larger.
The story got even more convoluted by the rise of quantum mechanics at the dawn
of the 20th century when Max Planck and Albert Einstein introduced the idea that energy
in light is quantized. These quanta of light ultimately became known as photons. In order
to explain the photoelectric effect, Einstein proposed that radiation travels as particles, a
concept that scientists and natural philosophers had debated for 2500 years before him.
I will explain in Chapter 4 why photons traveling from Sun cannot physically exist, even
though they provide a very useful mathematical shorthand.
Max Planck postulated, in 1900, that the energy in radiation is equal to vibrational
frequency times a constant, as is true of an atomic oscillator, in which a bond holding two
atoms together is oscillating in some way. He needed this postulate in order to derive an
equation by trial and error that could account for and calculate the observed properties of
radiation. Planck’s postulate led to Albert Einstein’s light quanta and to modern physics,
dominated by quantum mechanics and quantum electrodynamics. Curiously, however,
Planck didn’t fully appreciate the far-reaching implications of his simple postulate, which
states that the energy in radiation is equal to frequency times a constant. He simply saw it as a useful mathematical trick.
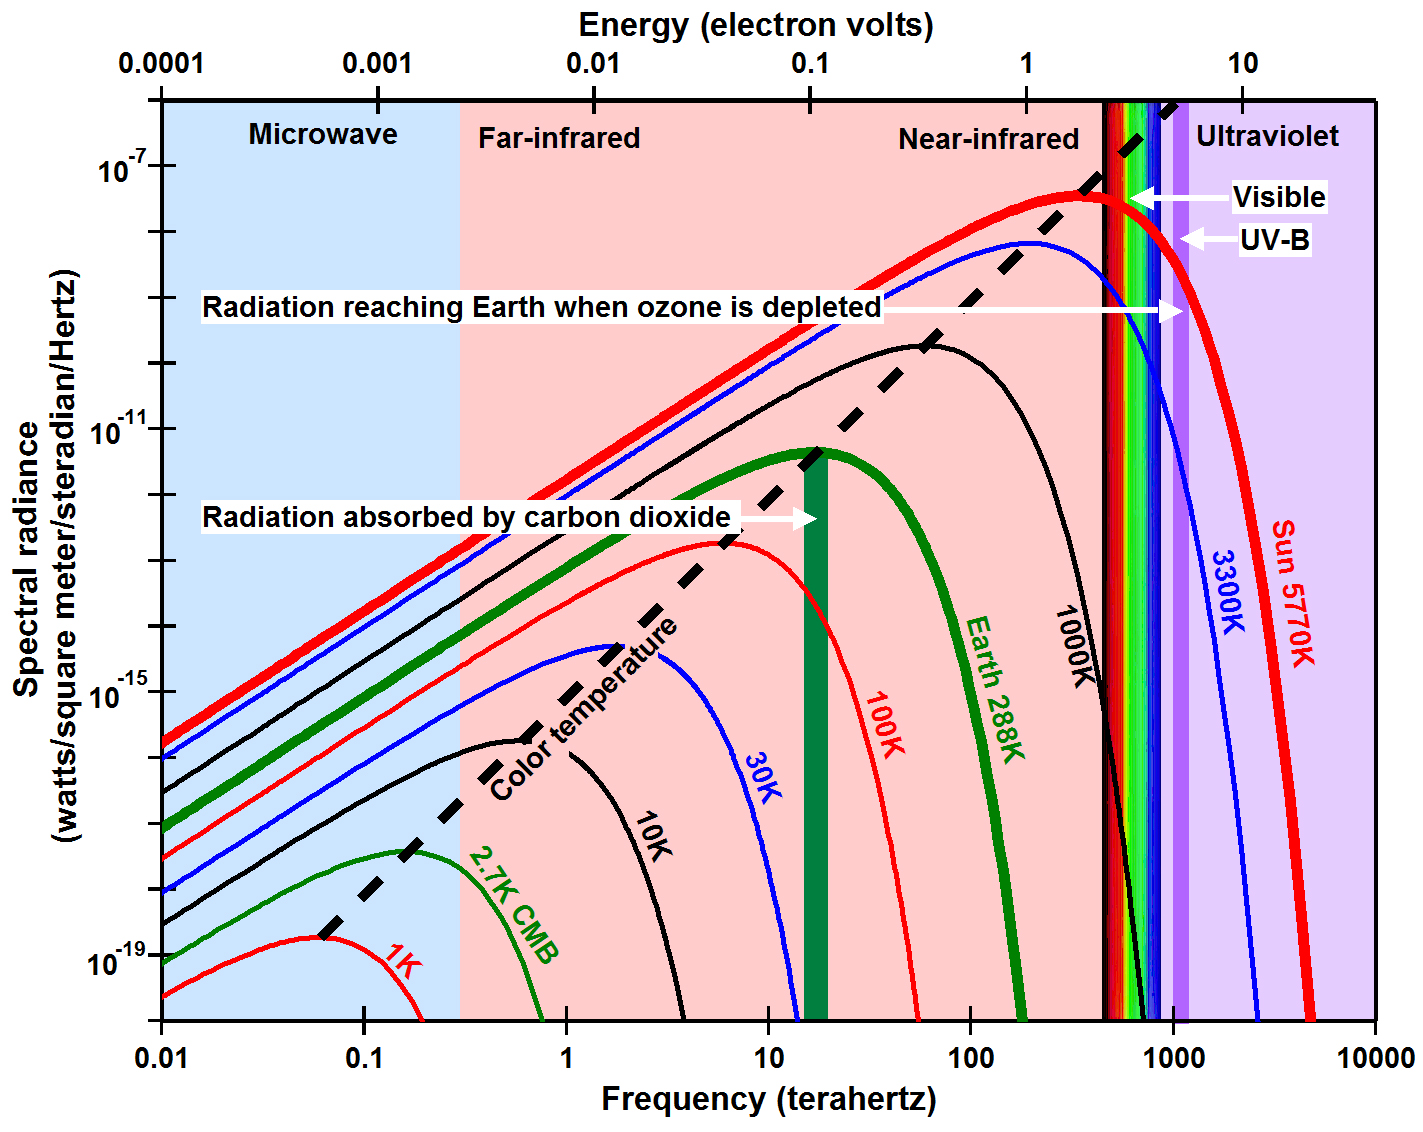
Energy is a function of frequency and should therefore be plotted on the x-axis (top of this figure) and units of watts should not be included on the y-axis. The colored lines show the spectral radiance predicted by Planck’s law for black bodies with different absolute temperatures.
As I dug deeper, it took me several years to become comfortable with those implications.
It was not the way we were trained to think. It was not the way most physicists think, even
today. Being retired turned out to be very useful because I could give my brain time to mull
this over. Gradually, it began to make sense. The take-away message for me was that the
energy in the kind of ultraviolet radiation that reaches Earth when ozone is depleted is 48 times “hotter” than infrared energy absorbed by greenhouse gases. In sufficient quantities, it should be correspondingly 48 times more effective in raising Earth’s surface temperature than the weak infrared radiation from Earth’s surface that is absorbed by carbon dioxide in the atmosphere and supposedly re-radiated back to the ground.
There simply is not enough energy involved with greenhouse gases to have a significant
effect on global warming. Reducing emissions of greenhouse gases will therefore not be
effective in reducing global warming. This conclusion is critical right now because most of
the world’s nations are planning to meet in Paris, France, in late November 2015, to agree
on legally binding limits to greenhouse-gas emissions. Such limits would be very expensive
as well as socioeconomically disruptive. We depend on large amounts of affordable energy to support our lifestyles, and developing countries also depend on large amounts of affordable energy to improve their lifestyles. Increasing the cost of energy by even a few percent would have major negative financial and societal repercussions.
This book is your chance to join my odyssey. You do not need to have majored in
science or even to be familiar with physics, chemistry, mathematics, or climatology. You
just need to be curious and be willing to work. You also need to be willing to think critically
about observations, and you may need to reevaluate some of your own ideas about climate.
You will learn that there was a slight misunderstanding in science made back in the 1860s
that has had profound implications for understanding climate change and physics today. It took me many years of hard work to gain this insight, and I will discuss that in Chapter 4. First, however, we need to look at some fundamental observations that cause us to wonder: Could the greenhouse warming theory of climate change actually be mistaken?
Footnote:
I welcome this analysis and assessment that explain why rising CO2 concentrations in the satellite era have no discernable impact on the radiative profile of the atmosphere. See Global Warming Theory and the Tests It Fails

Most of the images on this page don’t show up. Something to do with not having to correct certificates.
LikeLike
I am not having the problem. Can you tell me which ones and what is the error message?
LikeLike
Depending upon your browser, there are settings that allow/prevent websites from displaying properly.
Chrome has a button top the left of the url that looks like a lock silhouette.
IE’s setting are in their settings. Add the website to the trusted category.
I also enable flash and MIDI control.
For some websites; e.g. National Weather Service and many other USA Federal websites, you should enable pop-ups and redirects because the Feds haven’t gotten the message that people hate pop-ups plus they can be virally invasive. Anyway, many of the data report windows are pop-ups.
I do not use Mozilla or Edge.
LikeLike
Thanks Theo. I trust the images on this page displayed for you.
LikeLike
I see the images just fine, but cannot see the link to the book. Is this available in a Kindle edition?
LikeLike
oil, the book is available here
https://whyclimatechanges.com/the-book/
And yes there is a kindle version at Amazon.
LikeLike
Reblogged this on Climate Collections.
LikeLike
Hi Ron,
The charts Nr. 2, 4, 5, 6, aren’t loading
Fig. 1.9 and 1.10 are loading just fine.
Interesting stuff !!!!!
LikeLike
Thanks for that info Raymond. I think some browsers security settings block downloading those images directly from Ward’s website for some reason. I have downloaded them and linked to my blogsite and they should work now for everyone.
LikeLike