Click on image to enlarge.
The image above shows ice extents for yesterday, day 239, from 2007 to 2017. Particularly interesting is the variation in the CAA (Canadian Arctic Archipelago), crucial for the Northwest Passage. (The region is located just north of the word “Sea” in gold.) Note that 2016 was a fine year for cruising with the passage completely open at this date. That was not the case in 2014, and this year also has places frozen solid.

Crystal Serenity is going through the Northwest Passage again this year, having left Seward Alaska on Aug. 15, 2017. She arrives at Cambridge Bay today, having traveled in the wake of icebreaker RRS Ernest Shackleton. The next part of the voyage could be challenging.

The graph of August NH ice extents shows 2017 has moved above the decadal average in recent days. (Ten-year average is for 2007 to 2016 inclusive)
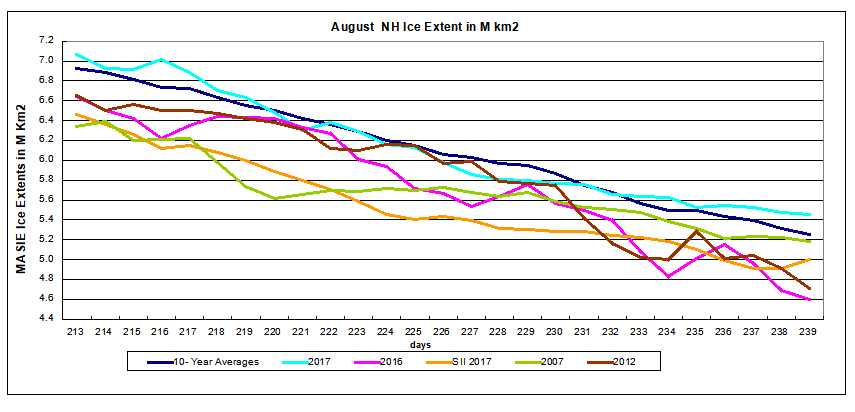
This year is now 850k km2 greater than 2016 and exceeds the 10 year average by 200k km2. SII (Sea Ice Index) 2017 is also 450k km2 lower. A previous post Beware the Arctic Storms of August discussed how late summer storms have dramatic impacts, and the graph shows both 2012 and 2016 plummeting in the last ten days. By the end of the month in four days, those two years will go below 4.4M km2.
By the way, Barents is still above average and holding steady near 50k km2.

The black line is average for the last 11 years. 2007 in purple appears close to an average year. 2014 had the highest annual extent in Barents Sea, due to higher and later maximums, holding onto ice during the summer, and recovering quickly. In contrast, 2016 was the lowest annual extent, melting out early and recovering later. 2017 in blue started out way behind, but grew rapidly to reach average, and then persisted longer to exceed even 2014. It will be important to see when the recovery of ice begins.
For more on why Barents Sea matters see Barents Icicles

Footnote
Some people unhappy with the higher amounts of ice extent shown by MASIE continue to claim that Sea Ice Index is the only dataset that can be used. This is false in fact and in logic. Why should anyone accept that the highest quality picture of ice day to day has no shelf life, that one year’s charts can not be compared with another year? Researchers do this, including Walt Meier in charge of Sea Ice Index. That said, I understand his interest in directing people to use his product rather than one he does not control. As I have said before:
MASIE is rigorous, reliable, serves as calibration for satellite products, and continues the long and honorable tradition of naval ice charting using modern technologies. More on this at my post Support MASIE Arctic Ice Dataset

Crystal Serenity and escort near Cambridge Bay in 2016.

Reblogged this on WeatherAction News.
LikeLike
Reblogged this on Climate Collections.
LikeLike
No chance of an early refreeze in the NW Passage I suppose.
Does it ever start freezing up earlier than the 21st?
ENSO just turned vaguely negative so global surface temps should keep dropping for a few months.
LikeLike
Give them a big serve if, if there is any sign of an early refreeze soon Ron
LikeLike
I’m on it angech, but it is like watching the Queen Mary changing course. Don’t hold your breath, but you will be among the first to know.
LikeLike