Click on image to enlarge.
The image above shows ice extents for day 233 from 2007 to 2017. Particularly interesting is the variation in the CAA (Canadian Arctic Archipelago), crucial for the Northwest Passage. (The region is located just north of the words “Ice Extent” in gold.) Note that 2016 was a fine year for cruising with the passage completely open at this date. That was not the case in 2014, and this year is also frozen solid.
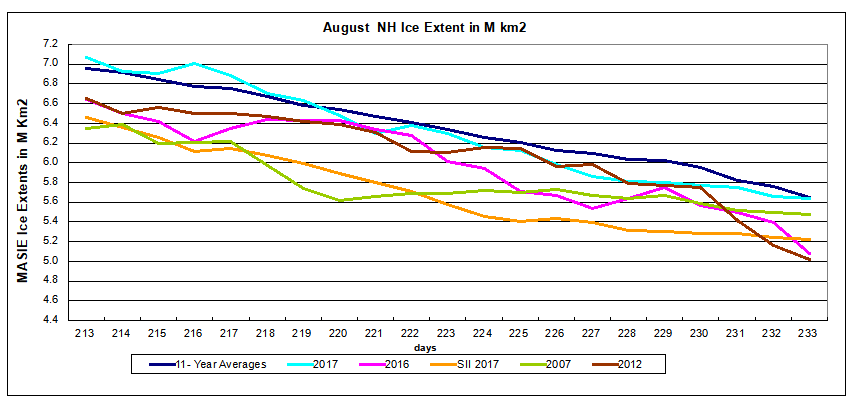
The graph of August NH ice extents shows 2017 virtually tied with the decadal average as of yesterday. This year is now 550k km2 greater than 2016 and exceeds 2007 by 250k km2. SII (Sea Ice Index) 2017 is also 400k km2 lower. A previous post Beware the Arctic Storms of August discussed how late summer storms have dramatic impacts, and the graph shows both 2012 and 2016 plummeting in the last five days. By the end of the month in nine days, those two years will go below 4.4M km2.
The Table compares 2017 day 233 ice extents with the decadal average and 2007. it is evident that this year’s extents are in surplus on the Canadian side and Central Arctic, offset by deficits on the Pacific side.
| Region | 2017233 | Day 233 Average |
2017-Ave. | 2007234 | 2017-2007 |
| (0) Northern_Hemisphere | 5634884 | 5652704 | -17820 | 5388004 | 246880 |
| (1) Beaufort_Sea | 569472 | 643245 | -73773 | 731647 | -162175 |
| (2) Chukchi_Sea | 285855 | 399788 | -113934 | 222895 | 62959 |
| (3) East_Siberian_Sea | 386603 | 517871 | -131268 | 81989 | 304614 |
| (4) Laptev_Sea | 308812 | 244158 | 64655 | 295384 | 13428 |
| (5) Kara_Sea | 65151 | 86439 | -21288 | 161780 | -96628 |
| (6) Barents_Sea | 33482 | 22883 | 10599 | 18656 | 14826 |
| (7) Greenland_Sea | 184582 | 222908 | -38326 | 335976 | -151394 |
| (8) Baffin_Bay_Gulf_of_St._Lawrence | 92400 | 37803 | 54597 | 51008 | 41392 |
| (9) Canadian_Archipelago | 494273 | 353728 | 140546 | 325028 | 169245 |
| (10) Hudson_Bay | 34936 | 43613 | -8677 | 61078 | -26141 |
| (11) Central_Arctic | 3178159 | 3079193 | 98966 | 3101306 | 76853 |
By the way, Barents is still above average and just added some ice.
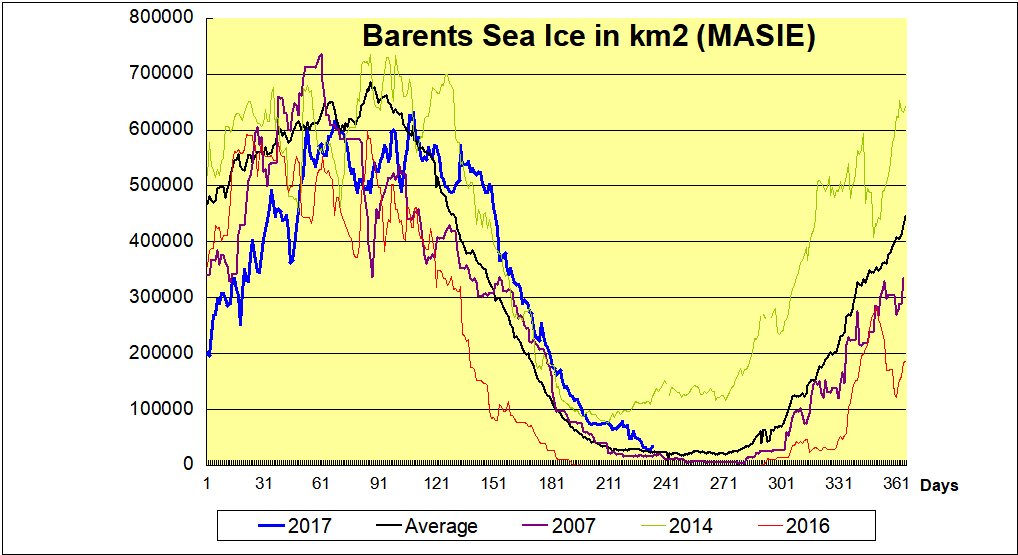
The black line is average for the last 11 years. 2007 in purple appears close to an average year. 2014 had the highest annual extent in Barents Sea, due to higher and later maximums, holding onto ice during the summer, and recovering quickly. In contrast, 2016 was the lowest annual extent, melting out early and recovering later. 2017 in blue started out way behind, but grew rapidly to reach average, and then persisted longer to exceed even 2014. It will be important to see when the recovery of ice begins.
For more on why Barents Sea matters see Barents Icicles
Summary and Outlook

As discussed above, weather these few weeks will determine the fate of ice extents. Here is the Arctic Oscillation and Polar Vortex Analysis and Forecast from August 21, 2017 by Dr. Judah Cohen from Atmospheric and Environmental Research (AER).
The AO is currently neutral (Figure 1), reflective of mostly mixed geopotential height anomalies across the Arctic and mixed geopotential height anomalies across the mid-latitudes of the NH (Figure 2). Geopotential height anomalies are also mixed across Greenland and Iceland (Figure 2), and therefore the NAO is also neutral. However blocking/high pressure will strengthen first across Northern Canada and eventually across Greenland forcing the AO/NAO into negative territory over the next two weeks.

New snowfall is also predicted over the Arctic sea ice over the coming two weeks, a sign that the Arctic sea ice melt season is coming to an end. It was never in doubt that once again Arctic sea ice would be well below normal this summer. However predicted new snowfall will retard sea ice melt and a new record low minimum seems unlikely. The trajectory of sea ice extent seems similar to 2007, 2011, 2015 and 2016 and will likely bottom out close to those group of years. If the melt season ends early then there is even an outside chance it could even match the years of 2008 and 2010.

Footnote
Some people unhappy with the higher amounts of ice extent shown by MASIE continue to claim that Sea Ice Index is the only dataset that can be used. This is false in fact and in logic. Why should anyone accept that the highest quality picture of ice day to day has no shelf life, that one year’s charts can not be compared with another year? Researchers do this, including Walt Meier in charge of Sea Ice Index. That said, I understand his interest in directing people to use his product rather than one he does not control. As I have said before:
MASIE is rigorous, reliable, serves as calibration for satellite products, and continues the long and honorable tradition of naval ice charting using modern technologies. More on this at my post Support MASIE Arctic Ice Dataset

2 comments