
From Yale Climate Connections we heard last week about Nunavut melting and a theatrical production to spread news and concerns about this dangerous development.
“I come from a place of rugged mountains, imperial glaciers and tender-covered permafrost. But Nunavut, our land, is only as rich as it is cold, and today most of it is melting.”That’s Chantal Bilodeau, reading a passage from “Sila,” a play about the effects of climate change in the Arctic.
The characters in her play include polar bears, an Inuit goddess, scientists, and coast guard officers – all working together to save their land.
No doubt her personal experience and feelings for her Nunavut are sincere and profound. (Originally I thought it was her homeland, but in fact she is a New York playwright and translator, born in Montreal.) And there will be a large audience receptive to her concerns about global warming. (Bilodeau has writen six plays about the Arctic and founded the international network Artists And Climate Change.) But I wonder if scientific measurements support her belief that Nunavut is melting.
After all, we have learned from medical research that individual life experiences (anecdotes) may not be true more generally. That is why drugs are tested on population samples with double-blind studies: neither the patient nor the doctor knows who gets the medicine and who gets the placebo.
So I went looking for weather station records to see what is the warming trend in that region. As curiosity does so often, it led me on a journey of discovery, learning some new things, and relearning old ones with fresh implications.
Where are temperatures measured in Nunavut?
It is by far the Northernmost territory of Canada, just off the coast of Northern Greenland.

According to Environment Canada, weather is reported at 29 places in Nunavut. So I went to look at the record at Iqaluit, the capital of the territory. You get monthly normals for the period 1981 to 2010. Historical data (daily averages) can be accessed only 1 individual month/year at a time, the menu stops at 2004. Even then, some months are filled with “M” for missing. Historical data from which trends can be analyzed is hard to come by.
Disappearing Weather Records
It turns out that Nunavut also suffered from the great purging of weather station records that was noticed by skeptics years ago.
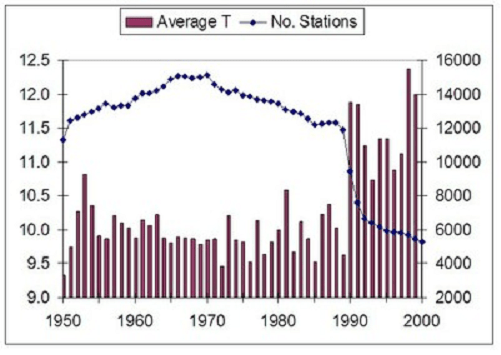
Graph showing the correlation between Global Mean Temperature (Average T) and the number of stations included in the global database. Source: Ross McKitrick, U of Guelph
I was aware of this because of a recent study looking at trends at stations around the Arctic circle. Arctic Warming Unalarming. That study included graphs that showed the dramatic removal of station records in the North. Though the depletion was not limited to the far North, many Canadian and Russian records disappeared from the global database.

Fig. 6 Temperature change for annual Arctic averages relative to the temperature during 1961 to 1990 for stations in Europe having more than 150 years of observations. The red curve is the moving 5-year average while the blue curve shows the number of stations reporting in each year. 118 stations contributed to the study. W. A. van Wijngaarden, Theoretical & Applied Climatology (2015)
Eureka, Nunavut, Canada “Last Station above latitude 65N”
Eureka got considerable attention in 2010 due to its surviving the dying out of weather stations. The phrase in quotes above reflects an observation that GISS uses Eureka data to infill across the whole Arctic Circle. That single station record is hugely magnified in its global impact in that temperature reconstruction product. Somewhat like the influence of a single tree in Yamal upon the infamous hockey stick graph.

The first High Arctic Weather Station in history, Eureka was established in April 1947 at 80-degrees north latitude in the vicinity of two rivers, which provided fresh water to the six-man United States Army Air Force team that parachuted in. They erected Jamesway huts to shelter themselves and their equipment until August, when an icebreaker reached Eureka – as it has every year since – and brought permanent buildings and supplies. For decades after that, small, all-male crews would hunker down for entire winters, going a little stir-crazy from the isolation. WUWT 2010
GHCN Records for Nunavut
It turns out that in addition to Eureka, GCHN has data for Alert and Clyde (River), but the latter two histories end in 2004 and 2010, respectively. The adjusted files have a few differences in details, but little change from the unadjusted files. The chart below shows the temperatures measured at Eureka, Nunavut, Canada 79° 98’ N, 85° 93’ W. The other two stations tell the same story as Eureka, though temperatures at Clyde are warmer in absolute terms due to its more Southerly location.

The chart shows Annual, July and January averages along with the lifetime averages of Eureka station from 1948 through 2015. There is slight variability, and a few years higher than average, but nothing alarming or even enough for people to sense any change. Note also that annual averages are well below freezing, because only 3 months are above 0° C. I suppose that someone could play with anomalies and generate a chart that looked scary, but the numbers in the record do not support fears of global warming and melting in Nunavut.
Conclusion
Once again we see media announcements that confuse subjective beliefs with empirical observations of objective reality. And unfortunately, those observations are less and less available to counter the herd instincts of fearing the future and blaming someone.
Footnote
The map at the top shows how crucial is Nunavut to the Polar Ocean Challenge. If the Northabout successfuly negotiates the Northern Sea Route (the Russian side), they then must pass from Beaufort Sea through the Parry Channel (or alternative passages) to get to Baffin Bay. Laptev is the first hurdle, and Nunavut is the last one.

Reblogged this on TheFlippinTruth.
LikeLike
Reblogged this on Canadian Climate Guy.
LikeLike
Hi Ron, I worked at Eureka in 1979-80. 8 of us guys. In February 1979, it set the N. American Record for coldest mean temperature at -47.9C….thankfully, I arrived in March :). I have heard that it has changed quite a bit, with a whole new Observation area from when I was up there…
Lance – Okotoks – Alberta
LikeLike
Thanks Lance, it is good to hear from someone who saw things firsthand.
LikeLike
I know from living in extreme cold, when it is 10 below zero F, it can feel warm if it was -50 F the night before!
LikeLike
Reblogged this on Climate Collections.
LikeLike