Updates 1 and 2 at bottom.
I recently came across this comment:
“During the height of the day at the equator, 1361 joules/m2/second (less 30% Albedo) is coming in from the Sun but the surface temperature only increases as if 0.0017 joules/m2/second is absorbed (or impacts the temperature at 2 meters). The extra 959.9983 joules/m2/second flows away from the surface effectively almost as fast as the energy is coming in.
Your calculator says surface temperatures should increase to 87C.
At night, virtually no radiation is coming in (and the upwelling less downwelling radiation) says the surface should be losing about 100 joules/m2/second but it actually only loses 0.001 joules/m2/second.
This is the real-world now versus the theoretical.” Bill Illis
http://wattsupwiththat.com/2011/02/13/a-conversation-with-an-infrared-radiation-expert/
And then Derek John posted this:
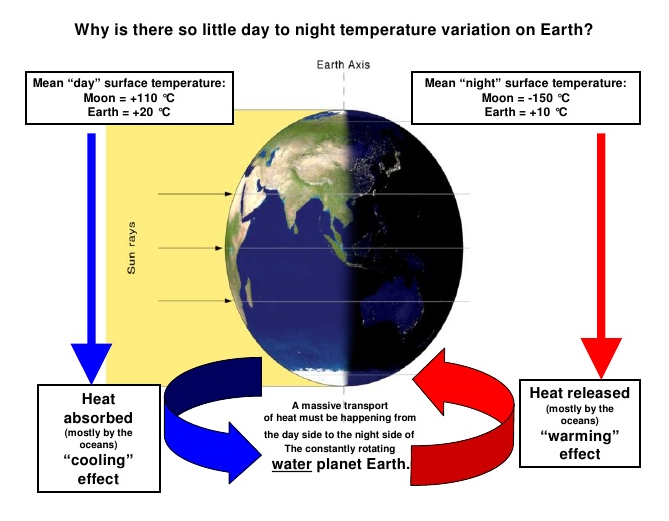
I was intrigued by the wheel in the diagram, but also puzzled about the numbers. In comparison to the moon, the earth’s temperature decrease is small, but still the image shows overnight cooling on average from 20C to 10C, in contradiction to the Illis comment above.
Digging deeper, I read in Wikipedia that diurnal SST (Sea Surface Temperature) is measured to vary on calm days by about 6C. But what it said next opened my eyes: “The temperature of the ocean at depth lags the Earth’s atmosphere temperature by 15 days per 10 meters (33 ft), which means for locations like the Aral sea, temperatures near its bottom reach a maximum in December and a minimum in May and June.”
You see? Illis is talking about the accumulation of heat, and the diagram shows surface temperatures, “surface” being the key word. In infrared remote sensing methodology the radiation emanates from the top “skin” of the ocean, approximately the top 0.01 mm or less. A 6C change there is nothing compared to the massive thermal capacity underneath. After all, the top 2 meters of the ocean match the entire heat in the overlaying atmosphere. And land surface temperatures aren’t measuring the surface, but rather the air 1 meter up. Sure the soil cools off at night, but go down even a few centimeters, and the warmth remains. People would not have built and lived in underground villages in places like Cappadocia if the land gave up its heat so readily.
And so I can understand something else Bill Illis said:
“The energy represented by a solar photon spends an average 43 hours in the Earth system before it is lost to space. Some spend just a millisecond while a very, very tiny percentage might get absorbed in the deep ocean and spend a thousand years on Earth or longer. In essence, the Earth has accumulated 1.9 days worth of solar energy. If the Sun did not come up tomorrow, it would take around 86 hours for at least the land temperature to fall below -200C.”
http://wattsupwiththat.com/2011/02/13/a-conversation-with-an-infrared-radiation-expert/#more-33954
6m (20ft) flywheel, weighs 15 tonnes. Used at Gepps Cross, Adelaide, South Australia Meatworks

The Oceans function as a Thermal Energy Flywheel
I’m speaking metaphorically, since flywheels like the one pictured above store rotational energy, and thereby maintain a steady rate, resisting periodic fluctuations. It seems that oceans have the same effect on the climate, by storing thermal energy from the sun. That’s where most of the 1.9 days of solar energy is circulating. The general term would be “accumulator”, such as rechargeable batteries, capacitors, or hydroelectric reservoirs. But I want to use flywheel because it is always in motion like the seas. And there is a precedent:
“The ocean is truly the flywheel of the climate system. By definition, a flywheel gains its efficiency from interactions with other parts of the system. Climate is determined, to a large extent, by the rates of energy transfer across the sea surface. It is these rates that determine the lag times and feedback loops and so ultimately the character of climate fluctuations in the oceans and elsewhere.”
Eric B. Kraus, 1987, ‘Oceans, Climate of’, in: Rhodes W. Fairbridge (ed.), The Encyclopaedia of Climatology (Earth Science), 1987, p.638-642
Models Missing the Ocean Flywheel

Climate science has been obsessed with only a part of the system, namely the atmosphere and radiation, in order to focus attention on the non-condensing IR active gases. The climate is framed as a 3D atmosphere above a 2D surface. That narrow scope leaves out the powerful non-radiative heat transfer mechanisms that dominate the lower troposphere, and the vast reservoir of thermal energy deep in the oceans.
As Dr. Robert E Stevenson writes, it could have been different:
“As an oceanographer, I’d been around the world, once or twice, and I was rather convinced that I knew the factors that influenced the Earth’s climate. The oceans, by virtue of their enormous density and heat-storage capacity, are the dominant influence on our climate. It is the heat budget and the energy that flows into and out of the oceans that basically determines the mean temperature of the global atmosphere. These interactions, plus evaporation, are quite capable of canceling the slight effect of man-produced CO2.”
In 1991, when the IUGG and its associations met in Vienna for their General Assembly, the presidents and the secretaries-general of the four associations I’ve mentioned, discussed the program we would propose to forward to the International Commission of Scientific Unions (ICSU) for consideration at the 1992 Rio de Janeiro Conference. We all decided not to prepare any programs!
In our joint statement, which I paraphrase here, we noted that “To single out one variable, namely radiation through the atmosphere and the associated ‘greenhouse effect,’ as being the primary driving force of atmospheric and oceanic climate, is a simplistic and absurd way to view the complex interaction of forces between the land, ocean, atmosphere, and outer space.”
Furthermore, we stated, “climate modeling has been concentrated on the atmosphere with only a primitive representation of the ocean.” Actually, some of the early models depict the oceans as nearly stagnant. The logical approach would have been to model the oceans first (there were some reasonable ocean models at the time), then adding the atmospheric factors.
Well, no one in ICSU nor the United Nations Environment Program/World Meteorological Organization was ecstatic about our suggestion. Rather, they simply proceeded to evolve climate models from early weather models. That has imposed an entirely atmospheric perspective on processes which are actually heavily dominated by the ocean.”
http://www.21stcenturysciencetech.com/articles/ocean.html
Efforts to Model the Ocean Flywheel
In the real world, radiative heat loss is determined by the temperature differential, fixed at the top of the atmosphere by the vacuum of space, and maintained at the bottom of the atmosphere by the oceans. The surface temperatures are noisy because the water is always in motion, made chaotic by flowing over and around irregular land masses. But the oceans’ bulk keeps the temperature within a remarkably tight range over the millennia.
More recently, the computer-driven models are coupled with ocean models, but often these are appendages, added on trying to improve the performance of atmospheric circulation. One of the features of these models is the setting used for the oceans’ “inertia”, which affects how slowly the artificial system responds to changes. The flywheel is a better metaphor since the oceans are always in motion while stabilizing temperatures and climate.

Some models are starting to have dynamic linking of ocean heat storage and circulation to the atmosphere. Results are proving interesting:
Climate Sensitivity to Changes in Ocean Heat Transport
Marcelo Barreiro et al 2011
http://journals.ametsoc.org/doi/full/10.1175/JCLI-D-10-05029.1
“According to our model, if the OHT increases further from present-day values, it would cool the global climate. Moreover, it shows large sensitivity to relatively small changes: a 25% increase in OHT cools the climate by more than 4 K (Fig. 2a). Further increases (beyond 25%) would also cool the climate but more gradually. The transition from a warming to a cooling effect of increased OHT is not gradual but abrupt. To better resolve this transition, we ran additional experiments for c = 1.05, 1.1, 1.15, and 1.20. Our results show that the occurrence of a warmer climate with increased OHT is valid for c < 1.15, which is for less than a 15% increase in the present-day values. Thus, in this model, the current climate is such that the ocean heat transport is close to its maximum positive influence.”
“To date, our understanding of the climatic response to changed OHT comes mainly from atmospheric models coupled to fixed oceans (e.g., W03, H05). Our results point out that not only is the lack of dynamical adjustment an important issue when using these models, but also that the parameterization of low clouds can result in cloud–SST radiative feedbacks of different strengths. In the end, only through the use of coupled models that allow the interaction between these processes will it be possible to address this question fully. Nonetheless, we believe the results presented here can serve as a guide for future explorations of the role of the oceans in climate.”
Another Gift from the Seas
It turns out that not only do the oceans maintain the mild habitat to which we are adapted, they also leave a climate record on the ocean floor. On longer time scales, the ocean flywheel is overwhelmed by orbital changes to the incoming solar energy, triggering regime shifts between the “Hot House” and the “Ice House”. Between shifts, the flywheel maintains the new steady state.

From Christopher R. Scotese, PALEOMAR Project
“There are also d18O isotopes which have proven to be very reliable proxies for temperature in the distant past. There are even International Standards for how to use these proxies to estimate temperature. Search Vienna Standard Mean Ocean Water if you want to know more about this.
The climate history charts in the article at the main post are based on this proxy of course.
There are d18O isotopes which have been dated going back all the way to 2.6 billion years ago. In total, there are 40,000 dated dO18 proxies covering the periods back to this time. 40,000 reliable proxies is more than enough to make a call about this history.
Here are the temperature estimates and all of the CO2 estimates over the last 40 million years (the data used in the paper are in this chart but I am using all the reliable numbers that there are, so rather than 8 data points, there is a total of 16,000 datapoints here between temps and CO2).”

When one runs the numbers in the proper way with these isotopes, one gets very close to Scotese’s temperature history. They can produce a higher resolution history than Scotese, however, which matches to a “T” the major developments in climate history that we know about from other disciplines like geology, paleontology etc.” Bill Illis
Summary
Dr. Stevenson summarizes:
“Contrary to recent press reports that the oceans hold the still-undetected global atmospheric warming predicted by climate models, ocean warming occurs in 100-year cycles, independent of both radiative and human influences.”
“Inland locations are less restrained by the oceans, so the surface air experiences a wider temperature range than it does over the oceans. Land cannot store heat for long, which is why hot days are quickly followed by cold nights in desert regions. For most of the Earth, however, the more dominant ocean temperatures fix the air temperature.”
“This happens through several means:
(1) The oceans transport heat around the globe via massive currents which sweep grandly through the various ocean basins. As a result, the tropics are cooler than they would be otherwise, and the lands of the high latitudes are warmer. The global circulation of heat in the oceans moderates the air temperatures around the whole world.
(2) Because of the high density/specific heat of sea water, the entire heat in the overlying atmosphere can be contained in the top two meters of the oceans. This enormous storage capacity enables the oceans to “buffer” any major deviations in temperature, moderating both heat and cold waves alike.
(3)Evaporation is constantly taking place at the surface of the seas. It is greatest in the tropics and weakest near the polar regions. The effect of evaporation is to cool the oceans and, thereby, the surface atmosphere.”
http://www.21stcenturysciencetech.com/articles/ocean.html

Conclusion
In the real world climate, water in all its phases is the heart of the matter, and atmosphere is ancillary. Since Copernicus we all think of our planetary system with the sun in the center. We should be thinking of our climate system with the oceans in the center.
How inappropriate to call this planet Earth when it is quite clearly Ocean. Arthur C. Clarke
I have been trying to make sense of these things, and this post is the result. Thank you to Bill Illis, Robert Stevenson and Arnd Bernaerts for writings I just discovered and which crystallized my thinking. Ron Clutz
Update 1 April 24: Discussion with David A. Is elevated to a post here:
https://rclutz.wordpress.com/2015/04/24/on-the-energy-highway-with-david-a-all-watts-are-not-created-equal/
Update 2 April 25: This essay mentions d18O from ocean sediments as a proxy for climate change. Below is linked an interesting study using these to reconstruct Norwegian Sea SST over several centuries
Comment by kennethrichards at Paul Homewood website:
And the warmer oceans during the MWP and modern times are explained (> 99% significance) by the solar variations at these times…the “medieval and modern [solar] maxima.”
—–
http://onlinelibrary.wiley.com/doi/10.1029/2010JC006264/full
“Here we present an exceptionally well-dated marine sediment sequence in the eastern Norwegian Sea which records 1–2°C variations of temperature in northward flowing Atlantic waters that are robustly correlated with various estimates of solar activity spanning the last 1000 years. The temperature and solar proxy variations appear to be synchronous within dating errors, which, together with the large amplitude of the temperature signal and its correlation into central Europe, suggests strong coupling of the regional atmospheric and oceanic responses to the Sun.”
Solar forcing of ocean SST . . .Hummmm. The plot thickens.


A fine essay very to the point! When Marcelo Barreiro et al 2011 says (ref. above): “To date, our understanding of the climatic response to changed OHT (ocean heat transport) comes mainly from atmospheric models coupled to fixed oceans”, he actually says the earth is a flat disc. Unfortunately they are not the only one knowing too little about the ‘climate water wheel’, and to use this clear statement as basis for climate change research.
LikeLike
Reblogged this on Tallbloke's Talkshop and commented:
Planet Earth or Planet Ocean? Ron Clutz offers a water-based model.
LikeLike
Interesting essay and happy to see it on two blogs, since I hope that the subject will be read by many people. I’m wondering, as I did on Tallbloke’s Talkshop aso: too far fatched to take water serious? About up to 90% of vapor around us is from the oceans (pending on the time scale)…..
LikeLike
Good Article IMV.
“The energy represented by a solar photon spends an average 43 hours in the Earth system before it is lost to space. Some spend just a millisecond while a very, very tiny percentage might get absorbed in the deep ocean and spend a thousand years on Earth or longer.”
=============================
A Law if you will; “Only two things can affect the energy content of a system in a radiative balance, either a change in the input, or a change in the residence time of some aspect of the energy within the system.”
In ALL cases not involving disparate solar insolation changes, the residence time of the energy must be understood in order to quantify the warming or cooling degree. For instance, clouds are capable of both increasing the residence time of some LWIR radiation from the surface, and decreasing the residence time of SW insolation from the Sun. The net affect is dependent on both the amount of energy affected, and the residence time of the energy affected, which is dependent on both the WL of the energy, and the materials said energy encounters.
I would like to clarify my residence time with a traffic analogy. Numbers are simplified to a ten basis, for ease of math and communication. Picture the earths system (Land, ocean and atmosphere) as a one lane highway. Ten cars per hour enter, (TSI) and ten cars per hour exit (representing radiation to space.) The cars (representing one watt per square meter) are on the highway for one hour. So there are ten cars on the highway. (the earth’s energy budget)
Now let us say the ten cars instantly slow to a ten hour travel time. Over a ten hour period, the energy budget will increase from ten cars, to 100 cars, with no change of input. Let us say we move to a one hundred hour travel time. Then there will be, over a one hundred hour time period, an increase of 990 cars.
Of course the real earth has thousands of lanes traveling at different speeds, and via conduction, convection, radiation, evaporation, condensing, albedo changes, GHGs, etc, etc, trillions of cars constantly changing lanes, with some on the highway for fractions of a second, and some for centuries. Also The sun changes WL over its polarity cycles far more then it changes total TSI. Additionally the sun can apparently enter phases of more active, or less active cycles which last for many decades.
Some factors increase residence time in the atmosphere (GHG) but may reduce energy entering a long term residence like the oceans. For Instance, W/V clear sky conditions, greatly reduces surface insolation at disparate W/L.
Such thoughts caused me to question the disparate contributions to earth’s total energy budget of SWR verses LWIR.
Such thought are cause for me to question the total amount of geothermal heat within the oceans, as many of these cars are on a very slow, century’s long lane.
It is true that 100 watts per sq. M of SWR, has the same energy as 100 watts per sq. M of LWIR, however their affect on earth’s energy balance can be dramatically different. In this sense, not all watts are equal.
For instance lets us say 100 watts of LWIR back radiation strikes the ocean surface. That energy then accelerates evaporation where said energy is lifted to altitude, and then condenses, liberating some of that energy to radiate to space. Now lets us assume the same 100 watts per sq M strikes the ocean, but this time it is composed of SWR, penetrating up to 800 ‘ deep. Some of that energy may stay with in the ocean for 800 years. The SWR has far more long term energy, and even warming potential then the LWIR.
Now, let us say the sun enters a multi decadal increased active phase, and the SWR W/L which deeply penetrates the ocean surface is .1 Watt per sq meter higher then previously. his .01 watt increase, due to the very long residence time, now accumulates in the ocean for the entire multi decadal solar increase.
The oceans are a three dimensional SW selective surface, and should never be treated like a simple blackbody.
LikeLike
David, thanks a lot for your comment. I take it that your traffic analogy refers to the flow of energy from the surface through the atmosphere to space. And in that case, the sun is like an assembly plant where cars are rolling into our system at a (mostly) constant rate. When the traffic jams, the additional cars continue to fill the road because they are impeded from turning off into space. An interesting point is the role of the oceans as a kind of parking lot with a variable release of cars onto the road, and thus acts as a buffer between the factory and the traffic flow.
I want to think next about the mechanisms at the interface between oceans and air.
LikeLike
Thank you Ron. To clarify, The highway is the earth’s system, defined as the “oceans, land, and atmosphere”, the on ramp is Total Solar Insolation, and the off ramp is radiation to space. So in this context albedo radiation is a Lamborghini, and the ocean is gridlock (or parking lot as you said) on the highway. Yes, the ocean is the dog, and the atmosphere is the tail, and a snubbed one at that.
A practical example is seen annually. in the SH summer, the earth receives about 7 percent more insolation, (a massive increase in input, close to 90 watts per sq. meter.) yet the atmosphere cools! Is the earth gaining or losing energy in the SH summer? There is certainly reduced residence time in the NH, due to increased albedo of snow on the land mass heavy N.H, and increased residence time in the SH, due to amplified SW ocean penetration. Both factors however remove energy from the atmosphere; the NH through reflecting energy to space, and the SH via absorbing the energy into the oceans, away from the atmosphere for much longer periods. So, despite a massive increase in insolation, the atmosphere cools, but does the earth gain or lose energy? I am guessing that it gains energy, unless SH cloud cover greatly expands, but I have never seen this quantified.
All non-input change theories on climate are a manifestation of the affect of “residence time.” I have found this useful in talking to “Slayers” I tell them the GHE is based on increasing the residence time of certain WL of LWIR energy via redirecting exiting LWIR energy back into the system, while input remains constant, thus more total energy is within the system. The greater the increase in residence time of the energy, the greater the potential energy accumulation.
In “slayers” defense I will say that some of the energy in the atmosphere is the result of conduction, and if conducted energy manifesting as heat strikes a GHG molecule, and is causative to that GHG molecule sending that energy to space, then said GHG molecule is cooling, as otherwise the conducted energy would have stayed within the atmosphere if it had simply conducted to another non GHG molecule. I have been unsuccessful in getting anyone to quantify how often this happens. In the lower atmosphere collision, or conduction transfers dominate and GHG molecule function pretty much the same as non GHG molecules, transferring energy via collision more rapidly then via radiation.
In this sense I maintain not all watts are equal. In a past WUWT post Willis asserted that the LWIR re-striking the surface, via back radiation, was equal to the SW striking the surface, sans the clouds presence. I maintained that while the watts may be equal, the SW was causative to a much greater overall energy within the “system” due to it longer residence time striking and penetrating the tropical SH ocean, up to 800 feet deep. ( the epipelagic Zone ) and some even deeper to 3000′ (Mesopelagic Zone)
The interchange between the ocean and the atmosphere is a very active place. My understanding is that the oceans are, on average, a bit warmer then the surface atmosphere. (The dog is wagging the tail)
Regarding LWIRs ability to heat the ocean, I am often struck by how black and white the argument usually goes; as in…”LWIR cannot warm the oceans”. The counter argument goes, “can to”. I watched a very long post at WUWT go on and on like that. I tried once or twice to say wait a minute guys, let quantify this, or admit we don’t know. In general I think most of the energy of LWIR goes into evaporation, convection, and energy release through condensing at altitude, and radiation lost to space. However I can see the potential for the surface in some areas to warm, and slow the release of ocean heat. But if the state of our climate science is such that we do not know the answer to this in detail, then this alone, ignoring a dozen other major unknowns, is, IMV, adequate to completely discount the models.
LikeLike
In my opinion it does not make much sense to consider the “residence time” of the solar energy absorbed by the atmosphere, earth and oceans. After all, the energy from the solar radiation absorbed warms up the molecules absorbing it and bringing such molecules to a higher kinetic energy level, which then results in sort of a chain reaction of dissipating that extra energy by conduction, convection and or thermal radiation.
Please note that according to : http://www.oceansjsu.com/105d/exped_briny/13.html
“only 73% of the surface light reaches a depth of 1 centimeter (less than a half inch)
•only 44.5% of the surface light reaches a depth of 1 meter (3.3 feet)
•22.2% of the surface light reaches a depth of 10 meters (33 feet)
•0.53% of the surface light reaches a depth of 100 meters (330 feet)
•0.0062% of the surface light reaches a depth of 200 meters
Bottom line — most of the light is absorbed or scattered within the top few meters of the ocean.”
Thus, the SW penetrating the ocean and absorbed by the water will warm up it resulting in natural convection to “sort of return” the energy gained towards the surface of the ocean, and or being convected away by a current.
I think that it is important to consider that even if the heat gained is being transferred away over a period of time, the process keeps going continuously: so, it does not appear that the concept of a residence time has relevance in the quasi steady thermal state of our planet as long as there are no other additional energy input and or reduction of the solar energy input, or reduction of the energy output.
LikeLike
See discussion here:
https://rclutz.wordpress.com/2015/04/24/on-the-energy-highway-with-david-a-all-watts-are-not-created-equal/
LikeLike
The absorbing of solar rays is only the beginning the ocean dynamics. Because the water column is far from static. As water releases energy into the air by conduction and even more by evaporation, that cooler water subsides and warmer water rises to be cooled in turn. This convective overturning goes on throughout the mixed layer, the turbulence ranging from 25 to 200 meters in depth. And there are other heat transports within the oceans, including currents, eddies and meanderings.
This is the ocean’s 3rd dimension that is missing in simplistic climate models. Focusing on the atmosphere and radiative heat transfer misses most of the action that affects the climate.
There is more here:
https://rclutz.wordpress.com/2015/05/11/dynamic-duo-the-ocean-air-partnership/
and here:
https://rclutz.wordpress.com/2015/05/10/empirical-evidence-oceans-make-climate/
LikeLike