Updated May 11,18 and 19 with text added at the end.
Further update on May 27 at the end.
You only have to compare Sea Surface Temperatures (SST) from HADSST3 with estimates of Global Mean Surface Temperatures (GMST) from Hadcrut4 and RSS.
This first graph shows how global SST has varied since 1850. There are obvious changepoints where the warming or cooling periods have occurred.
This graph shows in green Hadcrut4 estimates of global surface temperature, including ocean SST, and near surface air temperatures over land. The blue line from RSS tracks lower tropospheric air temperatures measured by satellites, not near the surface but many meters higher. Finally, the red line is again Hadsst3 global SST All lines use 30-month averages to reduce annual noise and display longer term patterns.
Strikingly, SST and GMST are almost synonymous from the beginning until about 1980. Then GMST diverges with more warming than global SST. Satellite TLT shows the same patterns but with less warming than the surface. Curious as to the post 1980s patterns, I looked into HADSST3 and found NH SST warmed much more strongly during that period.
This graph shows how warming from circulations in the Northern Pacific and Northern Atlantic drove GMST since 1980. And it suggests that since 2005 NH SST is no longer increasing, and may turn toward cooling.
Surface Heat Flux from Ocean to Air
Now one can read convoluted explanations about how rising CO2 in the atmosphere can cause land surface heating which is then transported over the ocean and causes higher SST. But the interface between ocean and air is well described and measured. Not surprisingly it is the warmer ocean water sending heat into the atmosphere, and not the other way around.
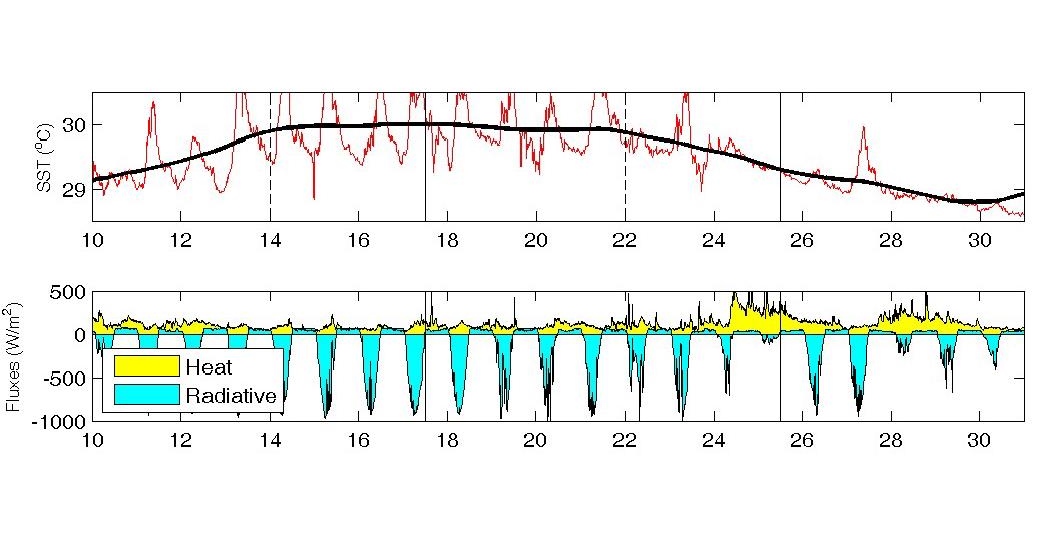
The graph displays measures of heat flux in the sub-tropics during a 21-day period in November. Shortwave solar energy shown above in green labeled radiative is stored in the upper 200 meters of the ocean. The upper panel shows the rise in SST (Sea Surface Temperature) due to net incoming energy. The yellow shows latent heat cooling the ocean, (lowering SST) and transferring heat upward, driving convection.
From
An Investigation of Turbulent Heat Exchange in the Subtropics
James B. Edson
“One can think of the ocean as a capacitor for the MJO (Madden-Julian Oscillation), where the energy is being accumulated when there is a net heat flux into the ocean (here occurring to approximately November 24) after which it is released to the atmosphere during the active phase of the MJO under high winds and large latent heat exchange.”
Conclusion
As we see in the graphs ocean circulations change sea surface temperatures which then cause global land and sea temperatures to change. Thus, oceans make climate by making temperature changes.
On another post I describe how oceans also drive precipitation, the other main determinant of climate. Oceans make rain, and the processes for distributing rain over land are shown here: https://rclutz.wordpress.com/2015/04/30/here-comes-the-rain-again/
And a word from Dr. William Gray:
“Changes in the ocean’s deep circulation currents appears to be, by far, the best physical explanation for the observed global surface temperature changes (see Gray 2009, 2011, 2012, 2012). It seems ridiculous to me for both the AGW advocates and us skeptics to so closely monitor current weather and short-time climate change as indication of CO2’s influence on our climate. This assumes that the much more dominant natural climate changes that have always occurred are no longer in operation or have relevance.”
Indeed, Oceans Make Climate, or as Dr. Arnd Bernaerts put it:
“Climate is the continuation of oceans by other means.”
Update 1 May 11, 2015
Kenneth Richards provided some supporting references in a comment at Paul Homewood’s site. They are certainly on point especially this one:
“Examining data sets of surface heat flux during the last few decades for the same region, we find that the SST warming was not a consequence of atmospheric heat flux forcing. Conversely, we suggest that long-term SST warming drives changes in atmosphere parameters at the sea surface, most notably an increase in latent heat flux, and that an acceleration of the hydrological cycle induces a strengthening of the trade winds and an acceleration of the Hadley circulation.”
That quote is from Servain et al, unfortunately behind a paywall. The paper is discussed here:
http://hockeyschtick.blogspot.ca/2014/09/new-paper-finds-climate-of-tropical.html
Full comment from Richards:
http://journals.ametsoc.org/doi/abs/10.1175/JCLI-D-13-00651.1
The surface of the world’s oceans has been warming since the beginning of industrialization. In addition to this, multidecadal sea surface temperature (SST) variations of internal [natural] origin exist. Evidence suggests that the North Atlantic Ocean exhibits the strongest multidecadal SST variations and that these variations are connected to the overturning circulation. This work investigates the extent to which these internal multidecadal variations have contributed to enhancing or diminishing the trend induced by the external radiative forcing, globally and in the North Atlantic. A model study is carried out wherein the analyses of a long control simulation with constant radiative forcing at preindustrial level and of an ensemble of simulations with historical forcing from 1850 until 2005 are combined. First, it is noted that global SST trends calculated from the different historical simulations are similar, while there is a large disagreement between the North Atlantic SST trends. Then the control simulation is analyzed, where a relationship between SST anomalies and anomalies in the Atlantic meridional overturning circulation (AMOC) for multidecadal and longer time scales is identified. This relationship enables the extraction of the AMOC-related SST variability from each individual member of the ensemble of historical simulations and then the calculation of the SST trends with the AMOC-related variability excluded. For the global SST trends this causes only a little difference while SST trends with AMOC-related variability excluded for the North Atlantic show closer agreement than with the AMOC-related variability included. From this it is concluded that AMOC [Atlantic meridional overturning circulation] variability has contributed significantly to North Atlantic SST trends since the mid nineteenth century.
—–
http://link.springer.com/article/10.1007%2Fs00382-014-2168-7
After a decrease of SST by about 1 °C during 1964–1975, most apparent in the northern tropical region, the entire tropical basin warmed up. That warming was the most substantial (>1 °C) in the eastern tropical ocean and in the longitudinal band of the intertropical convergence zone. Examining data sets of surface heat flux during the last few decades for the same region, we find that the SST [sea surface temperature] warming was not a consequence of atmospheric heat flux forcing [greenhouse gases]. Conversely, we suggest that long-term SST warming drives changes in atmosphere parameters at the sea surface, most notably an increase in latent heat flux, and that an acceleration of the hydrological cycle induces a strengthening of the trade winds and an acceleration of the Hadley circulation. These trends are also accompanied by rising sea levels and upper ocean heat content over similar multi-decadal time scales in the tropical Atlantic. Though more work is needed to fully understand these long term trends, especially what happens from the mid-1970’s, it is likely that changes in ocean circulation involving some combination of the Atlantic meridional overtuning circulation [AMOC] and the subtropical cells are required to explain the observations.
—–
http://www.nature.com/ncomms/2014/141208/ncomms6752/full/ncomms6752.html
The Atlantic Meridional Overturning Circulation (AMOC) is a key component of the global climate system, responsible for a large fraction of the 1.3 PW northward heat transport in the Atlantic basin. Numerical modelling experiments suggest that without a vigorous AMOC, surface air temperature in the North Atlantic region would cool by around 1–3 °C, with enhanced local cooling of up to 8 °C in regions with large sea-ice changes. Substantial weakening of the AMOC would also cause a southward shift of the inter-tropical convergence zone, encouraging Sahelian drought, and dynamic changes in sea level of up to 80 cm along the coasts of North America and Europe.
Update 2 May 18, 2015
This graph from Mike at climategrog shows more empirical evidence for ocean climate making, this time the relation to CO2 concentrations. The chart shows a high correlation between rates of change, not comparing directly the temperature or CO2 values or anomalies. Thus, a positive datapoint in the graph means an increase in the rate of change, negative being the rate changing downward.

The correlation is clear. There is no credible case for claiming that changes in CO2 cause changes in SST. Plenty of evidence that SST is the cause and CO2 the effect.
Update 3 May 19, 2015
On the ocean-air heat flux
Summary from
http://eesc.columbia.edu/courses/ees/climate/lectures/o_atm.html
Much of the direct and diffuse solar short wave (less than 2 micros, mostly in the visible range) electromagnetic radiation that reaches the sea surface penetrates the ocean heating the sea water down to about 100 to 200 meters. Solar heating of the ocean on a global average is 168 watts per square meter
The infrared radiation emitted from the ocean is quickly absorbed and re-emitted by water vapor and carbon dioxide and other greenhouse gases residing in the lower atmosphere. Much of the radiation from the atmospheric gases, also in the infrared range, is transmitted back to the ocean, reducing the net long wave radiation heat loss of the ocean. Net back radiation cools the ocean, on a global average by 66 watts per square meter.
When air is contact with the ocean is at a different temperature than that the sea surface, heat transfer by conduction takes place. On average the ocean is about 1 or 2 degrees warmer than the atmosphere so on average ocean heat is transferred from ocean to atmosphere by conduction.
If the ocean were colder than the atmosphere (which of course happens) the air in contact with the ocean cools, becoming denser and hence more stable, more stratified. As such the conduction process does a poor job of carrying the atmosphere heat into the cool ocean. On global average the oceanic heat loss by conduction is only 24 watts per square meter.
The largest heat loss for the ocean is due to evaporation, which links heat exchange with hydrological cycle (Fig. 4). On global average the heat loss by evaporation is 78 watts per square meter.
Update 4 May 19, 2015
Dr. William Gray in his 2012 paper:
“The global surface warming of about 0.7°C that has been experienced over the last 150 years and the multi-decadal up-and-down global temperature changes of 0.3-0.4°C that have been observed over this period are hypothesized to be driven by a combination of multi-century and multi-decadal ocean circulation changes. These ocean changes are due to naturally occurring upper ocean salinity variations. Changes in CO2 play little role in these salinity driven ocean climate forcings. “
Update 5 May 27, 2015
 The RAPID moorings being deployed. Credit: National Oceanography Centre
A new study, by scientists from the University of Southampton and National Oceanography Centre (NOC), implies that the global climate is on the verge of broad-scale change that could last for a number of decades. This new climatic phase could be half a degree cooler.
The change to the new set of climatic conditions is associated with a cooling of the Atlantic, and is likely to bring drier summers in Britain and Ireland, accelerated sea-level rise along the northeast coast of the United States, and drought in the developing countries of the Sahel region. Since this new climatic phase could be half a degree cooler, it may well offer a brief reprise from the rise of global temperatures, as well as resulting in fewer hurricanes hitting the United States.
The study, published in Nature, proves that ocean circulation is the link between weather and decadal scale climatic change. It is based on observational evidence of the link between ocean circulation and the decadal variability of sea surface temperatures in the Atlantic Ocean.
Lead author Dr Gerard McCarthy, from the NOC, said: “Sea-surface temperatures in the Atlantic vary between warm and cold over time-scales of many decades. These variations have been shown to influence temperature, rainfall, drought and even the frequency of hurricanes in many regions of the world. This decadal variability, called the Atlantic Multi-decadal Oscillation (AMO), is a notable feature of the Atlantic Ocean and the climate of the regions it influences.”
The strength of ocean currents has been measured by a network of sensors, called the RAPID array, which have been collecting data on the flow rate of the Atlantic meridonal overturning circulation (AMOC) for a decade.
Dr David Smeed, from the NOC and lead scientist of the RAPID project, adds: “The observations of AMOC from the RAPID array, over the past ten years, show that it is declining. As a result, we expect the AMO is moving to a negative phase, which will result in cooler surface waters. This is consistent with observations of temperature in the North Atlantic.”
http://www.sciencedaily.com/releases/2015/05/150527133932.htm
And an observation from Dr. Robert E. Stevenson:
“The atmosphere cannot warm until the underlying surface warms first. The lower atmosphere is transparent to direct solar radiation, preventing it from being significantly warmed by sunlight alone. The surface atmosphere thus gets its warmth in three ways: from direct contact with the oceans; from infrared radiation off the ocean surface; and, from the removal of latent heat from the ocean by evaporation. Consequently, the temperature of the lower atmosphere is largely determined by the temperature of the ocean.”
http://www.21stcenturysciencetech.com/articles/ocean.html

Reblogged this on Tallbloke's Talkshop and commented:
.
.
Ron Clutz restates some easily demonstrated truth bout the direction of energy flow from ocean to atmosphere.
LikeLike
One can look at all the absolute (not anomaly) monthly SST and TLT data from the satellite era and there is not even one ocean grid cell where SST is lower than TLT. The absolute differences are not small ranging from 5 to 20C higher in the ocean.
LikeLike
gymnosperm, thanks for your comment;sorry to be so slow to pick up on it. I am intrigued by “not even one ocean grid cell where SST is lower than TLT.” Can you point me to this analysis or to the sources; I have not worked with grid cells, and my notebook is probably not up to the processing.
LikeLike
Hi Ron,
Most of that comment is based on my own work: http://geosciencebigpicture.com/2014/10/05/the-ocean-ate-it/
Since my comment above it has been pointed out to me that TLT is an average measurement of the lower troposphere. I have looked hard but been unable to find any exact definition of “lower troposphere” nor at what altitude this average might be taken. Given this uncertainty it remains possible that there are in fact grid cells where the atmosphere is warmer than the ocean.

I found this from Singh et al 2005 that shows areas of negative sensible heat flux in upwelling areas where cold bottom water is warming and rising.
The atmospheric temperatures used by Singh were from ship’s night air measurements. This data is also a mess as it is taken a night to minimize the hot iron effects, is adjusted for the varying deck heights, and the “suez effect” when many ships piled stuff on deck to avoid some fee…
LikeLike
Thanks for explaining. I did find this from Bob Tisdale re UAH TLT:
” The lower troposphere temperature data include the altitudes of zero to about 12,500 meters, but are most heavily weighted to the altitudes of less than 3000 meters.” Taking the moist lapse rate to be 5.5C per km, that gives a difference around 16C, just from altitude. So no smoking gun there, your results are what would be expected from the lapse rate.
LikeLike
Interesting. I’ll ask Bob what the context of his comment was and how he derived his TLT numbers. Pretty much a mess. You may be interested in:http://images.remss.com/papers/rsspubs/Mears_JTECH_2009_TLT_construction.pdf
This seems to validate the TLT data with radiosonde data without once mentioning the altitude of correlation. As near as I can tell TLT is a derivative of a higher altitude “channel 2” corrected for stratospheric influence.
All confusing.What do you imagine “most heavily weighted to the altitudes of less than 3000 meters” actually means?
LikeLike
Bob’s post is here: https://bobtisdale.wordpress.com/2015/03/15/february-2015-global-surface-landocean-and-lower-troposphere-temperature-anomaly-model-data-difference-update/
He links to an illustration here:https://bobtisdale.files.wordpress.com/2014/04/tlt-tmt-tls-weighting.png
LikeLike
Reblogged this on CraigM350.
LikeLike
(1) Something needs correction. These graphs aren’t 30-year averages of either the centred variety or the “previous 30 years”. If they were, the graph would not span the entire period from 1850 to 2014 but be short at one or both ends. (2) I’d like to see the data at a finer resolution than 30 years because it’s too easy for averages to mask some critical issues. (3) To my mind there are many doubts about the accuracy of the HadSST3 data, particularly on coverage at both hemispheric and global levels. Frankly I don’t trust it prior to 1950 and after that only reluctantly use it because there’s no other data.
In general though I think the argument is basically very credible.
LikeLike
Thanks for that jdmcl. I am not an expert with the Wood For Trees utility, and can not explain in detail what happens when you choose 10 mean or 30 mean from their graphing menu. I assumed it was a running average to reduce the annual noise.
As you say, ocean measurements of all kinds are underfunded because of the preoccupation with atmosphere and modeling. But I went with HadSST3 as one of the better ones available.
LikeLike
After checking, I see that the datasets used monthly samples, so 10 mean averages 10 months, 30 mean is 2.5 years. I don’t know how that is applied at the ends of the series.
LikeLike
Reblogged this on Power To The People and commented:
A Disturbance In #Climate Farce: CO2UP 18+YrsNO Warming! @UN @EPA @Whitehouse LAH LAH LAH http://wp.me/pPrQ9-wSD
LikeLike