Thanks to Swiss Policy Research for providing perspective on the coronavirus contagion in a few charts. Their article is Covid: The Big Picture in 7 Charts, updated to October 10, 2020. Excerpts in italics with my bolds.
1) Global covid “cases” and deaths vs. all-cause deaths
Chart number one shows global covid deaths by September in blue (about 1 million) versus global all-cause deaths in purple (about 40 million). The chart also shows the cumulative number of global covid “cases” (i.e. positive PCR tests) – the so-called “casedemic” on top of the pandemic.
In contrast, the UN expects that the political reaction to the pandemic may put the livelihood of up to 1.6 billion people at immediate risk and may, by the end of 2020, push an additional 130 million people “to the brink of starvation” and an additional 150 million children into poverty.
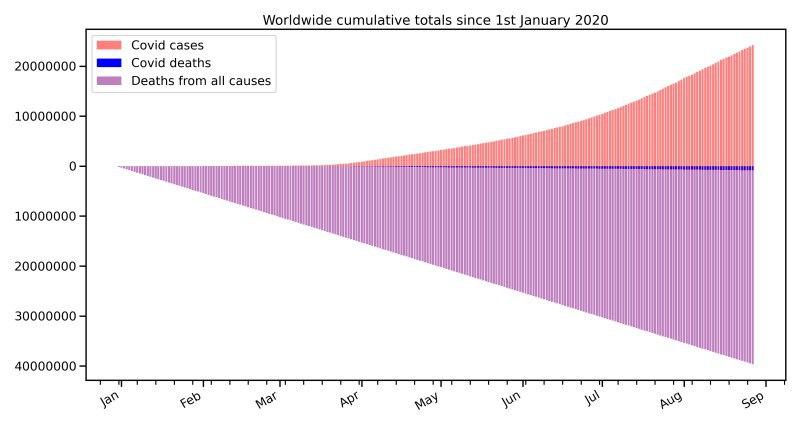
Global covid deaths and “cases” vs. all-cause deaths (interpolated data; source: OWD)
2) Covid mortality vs. flu mortality
Chart number two compares mortality by age for covid and for seasonal influenza (based on US CDC data). Below 50 years, influenza is somewhat deadlier than covid; above 50 years, covid is quickly getting deadlier than seasonal influenza (for which vaccines are available).
This “close to natural” mortality profile explains the very high median age of covid deaths in most Western countries (80 to 85 years in Europe, about 78 years in the US).
Overall, in Western countries a medium pandemic influenza (like 1957 and 1968) remains the best comparison to covid in terms of overall lethality and mortality. In non-Western countries, including Japan and most of Africa, covid mortality appears to be comparable to seasonal influenza.

Flu vs. covid mortality by age (CC/CDC). The chart in log-scale shows that COVID-19 is less lethal than flu up to the age of 48.
3) The role of nursing homes
Chart number three compares covid lethality (IFR) for the entire population (including nursing homes) and the non-nursing home population in Belgium (the hardest hit country in Europe; nevertheless, Belgian peak mortality is comparable to flu waves in the 1950s and 1960s.)
In most Western countries, nursing homes account for about 40% (Germany) to 80% (Canada and some US states) of all covid deaths, but they encompass only about 0.6% of the population; their IFR (ca. 30%) is about 100 times higher than for the general population (ca. 0.3%) and about ten times higher than for people of the same age group (75+) outside of nursing homes (ca. 3%, see below).
When calculating and communicating IFRs, it is therefore crucial to distinguish between the nursing home and the non-nursing home population in order to provide meaningful values. Nursing homes do not require a general lockdown of society, but targeted and humane protection.

Belgium: IFRs in entire population vs. non-nursing home population (Molenberghs)
4) Covid mortality in the USA
Chart number four shows monthly mortality in the USA since 1960. Regarding covid, the US is one of the hardest hit Western countries; nevertheless, its peak monthly mortality (driven by the Northeast region) is comparable to the strong influenza waves of the 1960s.
If covid had hit the US in the 1960s, its impact would have been much lower, due to a younger population, fewer nursing homes (which account for about 50% of US covid deaths), and much lower metabolic disease prevalence (i.e. diabetes, obesity and cardiovascular disease).
However, in much of the US (and Europe), coronavirus antibody prevalence is still below 10% (compared to values between 20 and 50% in global hotspots). It is therefore possible that the new coronavirus will cause additional deaths if high-risk population groups get infected. On the other hand, both intensive and early treatment options have improved in the meantime.

US: Monthly all-cause deaths since 1960 (Whelan/CDC)
5) Covid mortality in Sweden
Chart number five shows monthly mortality in Sweden since 1851. Sweden did not impose a covid lockdown, did not introduce a face mask mandate, and has one of the lowest intensive care bed capacities in Europe (two times lower than Italy). Nevertheless, its peak mortality is comparable to the strong seasonal flu waves of the 1990s. The chart also shows the k of the 1918 influenza pandemic and the nineteenth century cholera and hunger epidemics.
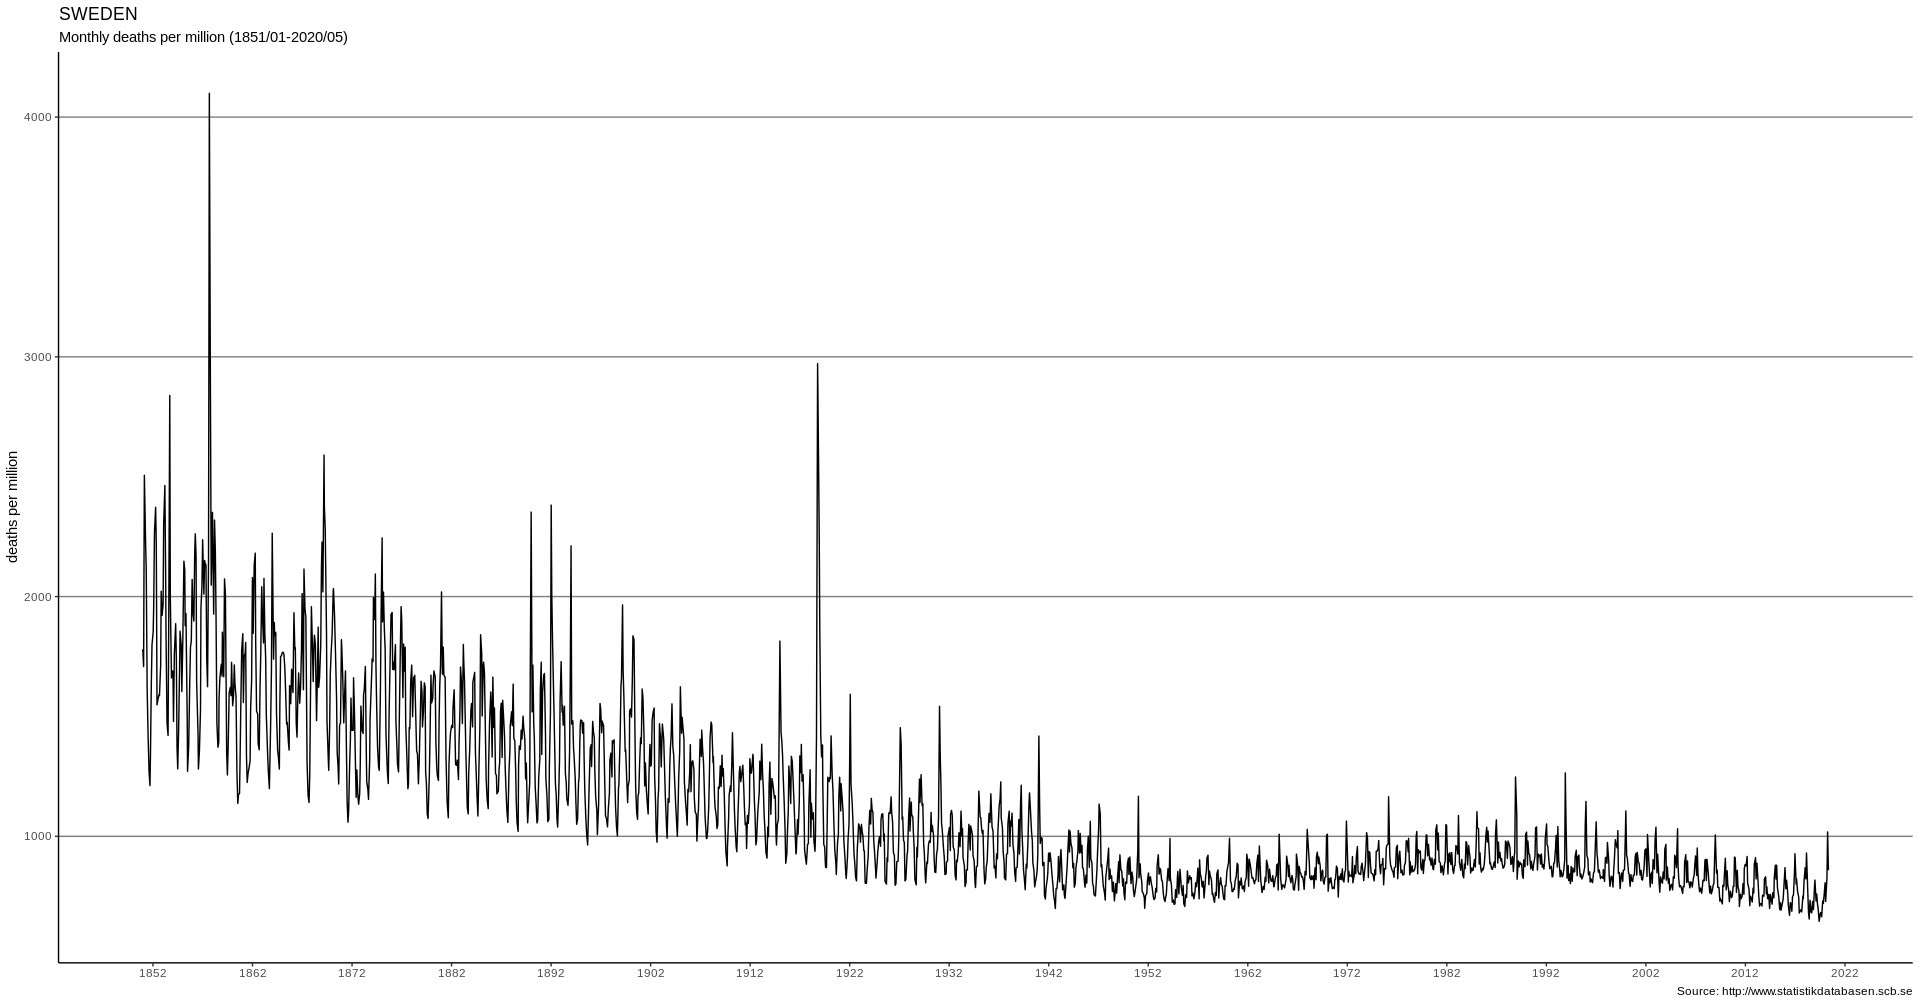
Sweden: Mortality since 1851 (JH/FOHM)
6) Epidemiological models vs. reality
Chart number six shows covid mortality in Sweden predicted by Imperial College London (professor Neil Ferguson) without measures (orange) and with moderate measures (gray), compared to the actual mortality curve (blue). 70% of Swedish deaths occurred in nursing facilities, while mortality in people below 65 remained below the five-year average.
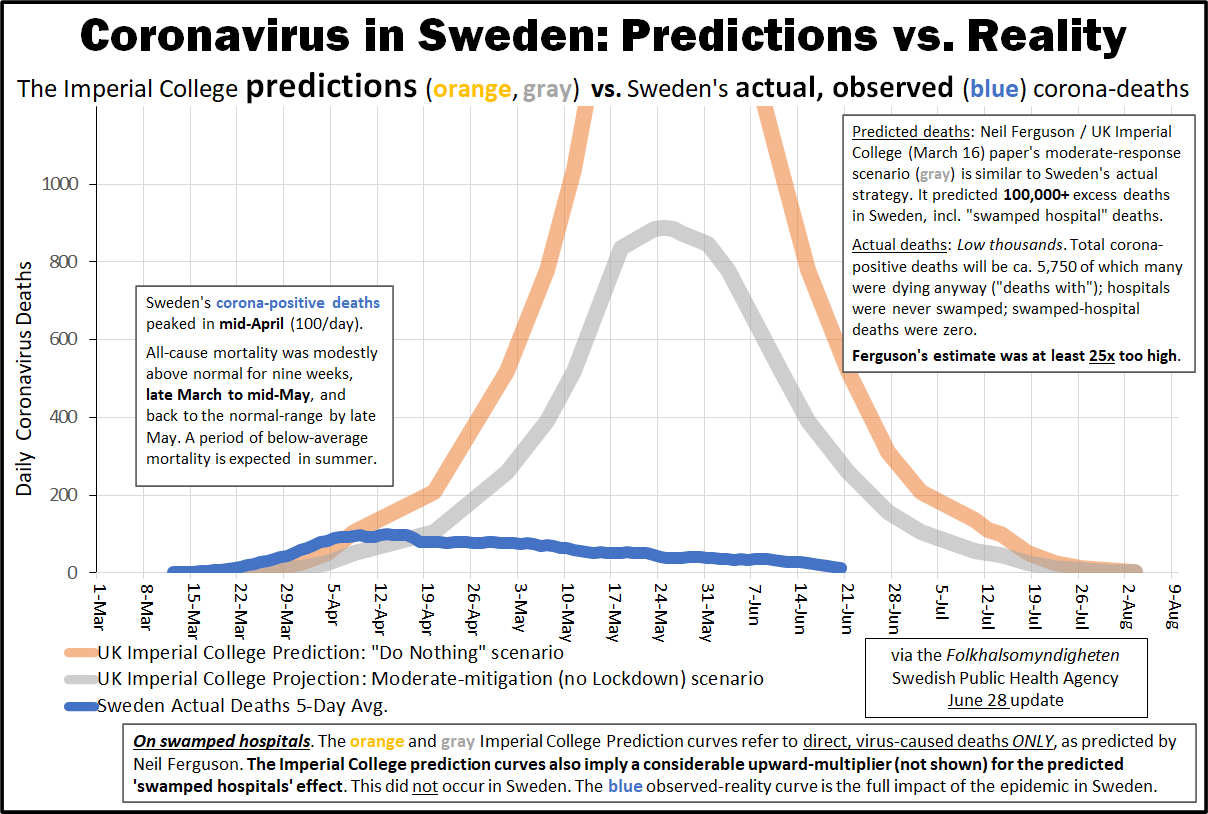
Sweden: Predicted deaths vs. reality (HTY/FOHM)
7) Economic and social impact of political measures
Chart number seven shows US job losses in post-1945 recessions. The political reaction to the new coronavirus, notably lockdowns, has caused the worst employment recession since 1945, putting millions of people out of job and bankrupting tens or hundreds of thousands of businesses.
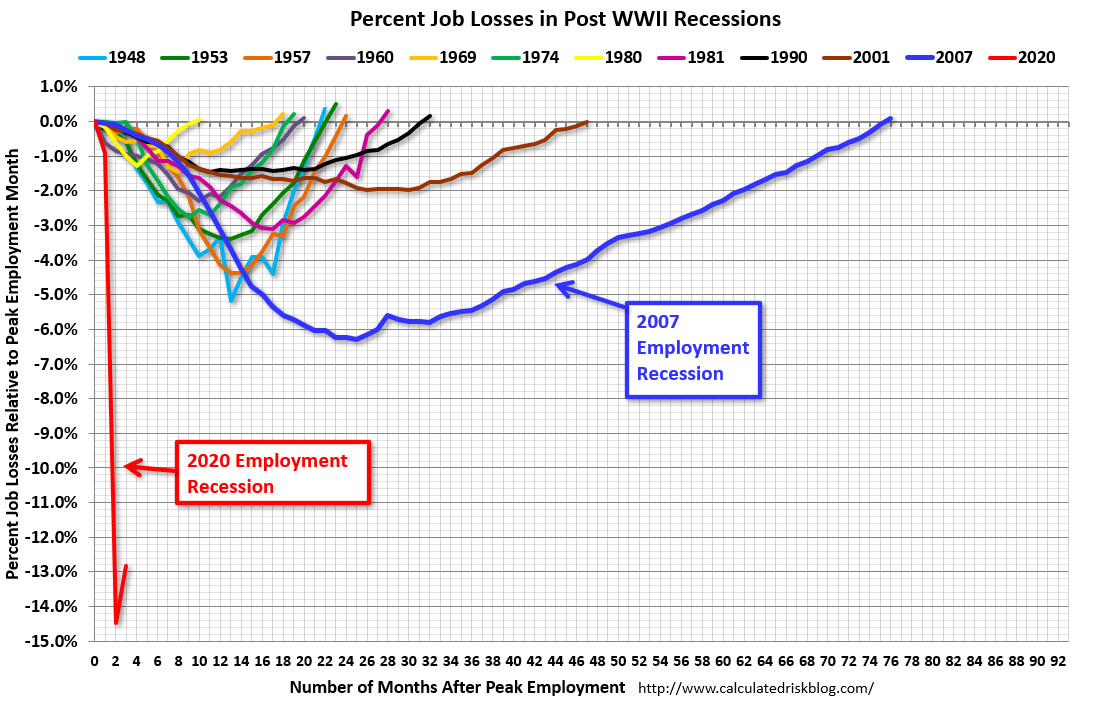
US recessions in comparison (BLS / CRB)
Conclusions
Covid is a very serious global public health issue, but:
- Talking about “cases” as if these were sick people is misguided.
- Talking about IFRs (lethality) without distinguishing between the general population and nursing homes, as well as early and late pandemic phase, is misguided.
- Saying covid is “worse than the flu”, without saying for whom, is misguided.
- Saying the recession is “due to covid”, not the political reaction, is misguided.
- Saying epidemiological models have been accurate and helpful, is also misguided.

Reblogged this on HiFast News Feed.
LikeLike