 The paper is Setting the tree-ring record straight by Josef Ludescher, Armin Bunde, Ulf Büntgen & Hans Joachim Schellnhuber. The title is extremely informative, since the trick is to flatten the tree-ring proxies, removing any warm periods to compare with the present. Excerpts below with my bolds.
Abstract
Tree-ring chronologies are the main source for annually resolved and absolutely dated temperature reconstructions of the last millennia and thus for studying the intriguing problem of climate impacts. Here we focus on central Europe and compare the tree-ring based temperature reconstruction with reconstructions from harvest dates, long meteorological measurements, and historical model data. We find that all data are long-term persistent, but in the tree-ring based reconstruction the strength of the persistence quantified by the Hurst exponent is remarkably larger (h≅1.02) than in the other data (h= 0.52–0.69), indicating an unrealistic exaggeration of the historical temperature variations. We show how to correct the tree-ring based reconstruction by a mathematical transformation that adjusts the persistence and leads to reduced amplitudes of the warm and cold periods. The new transformed record agrees well with both the observational data and the harvest dates-based reconstructions and allows more realistic studies of climate impacts. It confirms that the present warming is unprecedented.
Discussion
Figure 1a shows the tree-ring based reconstruction (TRBR) of central European summer temperatures (Büntgen et al. 2011), together with its 30 year moving average that reveals the long-term temperature variations in the record. Particularly large temperature increases occurred between 1340 and 1410 and between 1820 and 1870 that even are comparable in amplitude with the recent warming trend since 1970, indicating that the recent (anthropogenic) warming may not be unprecedented.
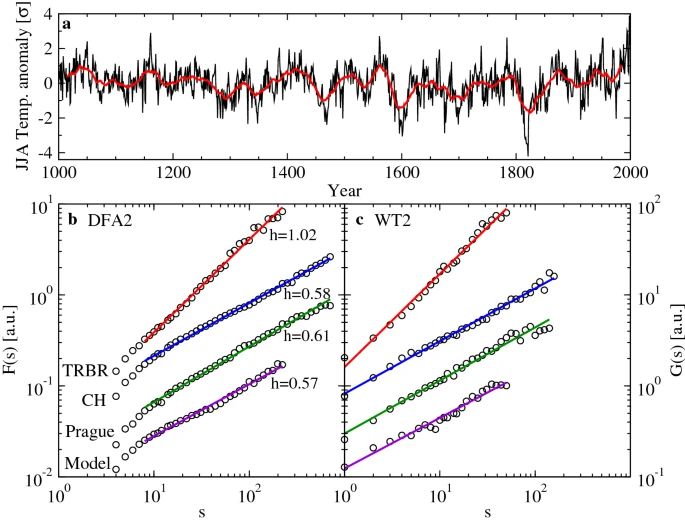
Tree ring-based reconstruction of the central European temperatures in the last millennium. a The reconstructed June-August temperatures in units of the records standard deviation. The red line depicts the moving average over 30 years. b, c The DFA2 fluctuation functions F(s) and the WT2 fluctuation functions G(s), respectively, for the reconstructed data from a, for monthly observational data (Swiss temperatures from Berkeley Earth, station data from Prague) and the MPI-ESM-P-past1000 model output for central European summer temperatures, from top to bottom. For the TRBR and model data, the time scale s is in years, while for the two observational records, it is in months. Note that in the double logarithmic presentation, the asymptotic slopes (Hurst exponents h) for the reconstruction data (h≅1) and the observational and model data (h≅0.6) differ strongly
To correct the enhanced long-term persistence in the TRBR, we are interested in a mathematical transformation of the data, which lowers the natural long-term persistence while leaving the gross features of the record, the positions of the warm and cold periods, unchanged. We performed the following mathematical transformation to change the original TRBR Hurst exponent h0=1.03 to h1=0.60 and thus to be in line with the observational, harvest and model data. Since this transformation is only suitable for altering a record’s natural long-term persistence, i.e., in the absence of external trends, we transformed the TRBR data between 1000 and 1990, before the current anthropogenic trend became relevant.
Figure 4a compares the transformed TRBR data (blue) with h1=0.6 with the original TRBR data (black). The bold lines are the 30-year moving averages. The figure shows that by the transformation the structure of the original TRBR data is conserved, but the climate variations characterized by the depths of the minima and the heights of the maxima are reduced.
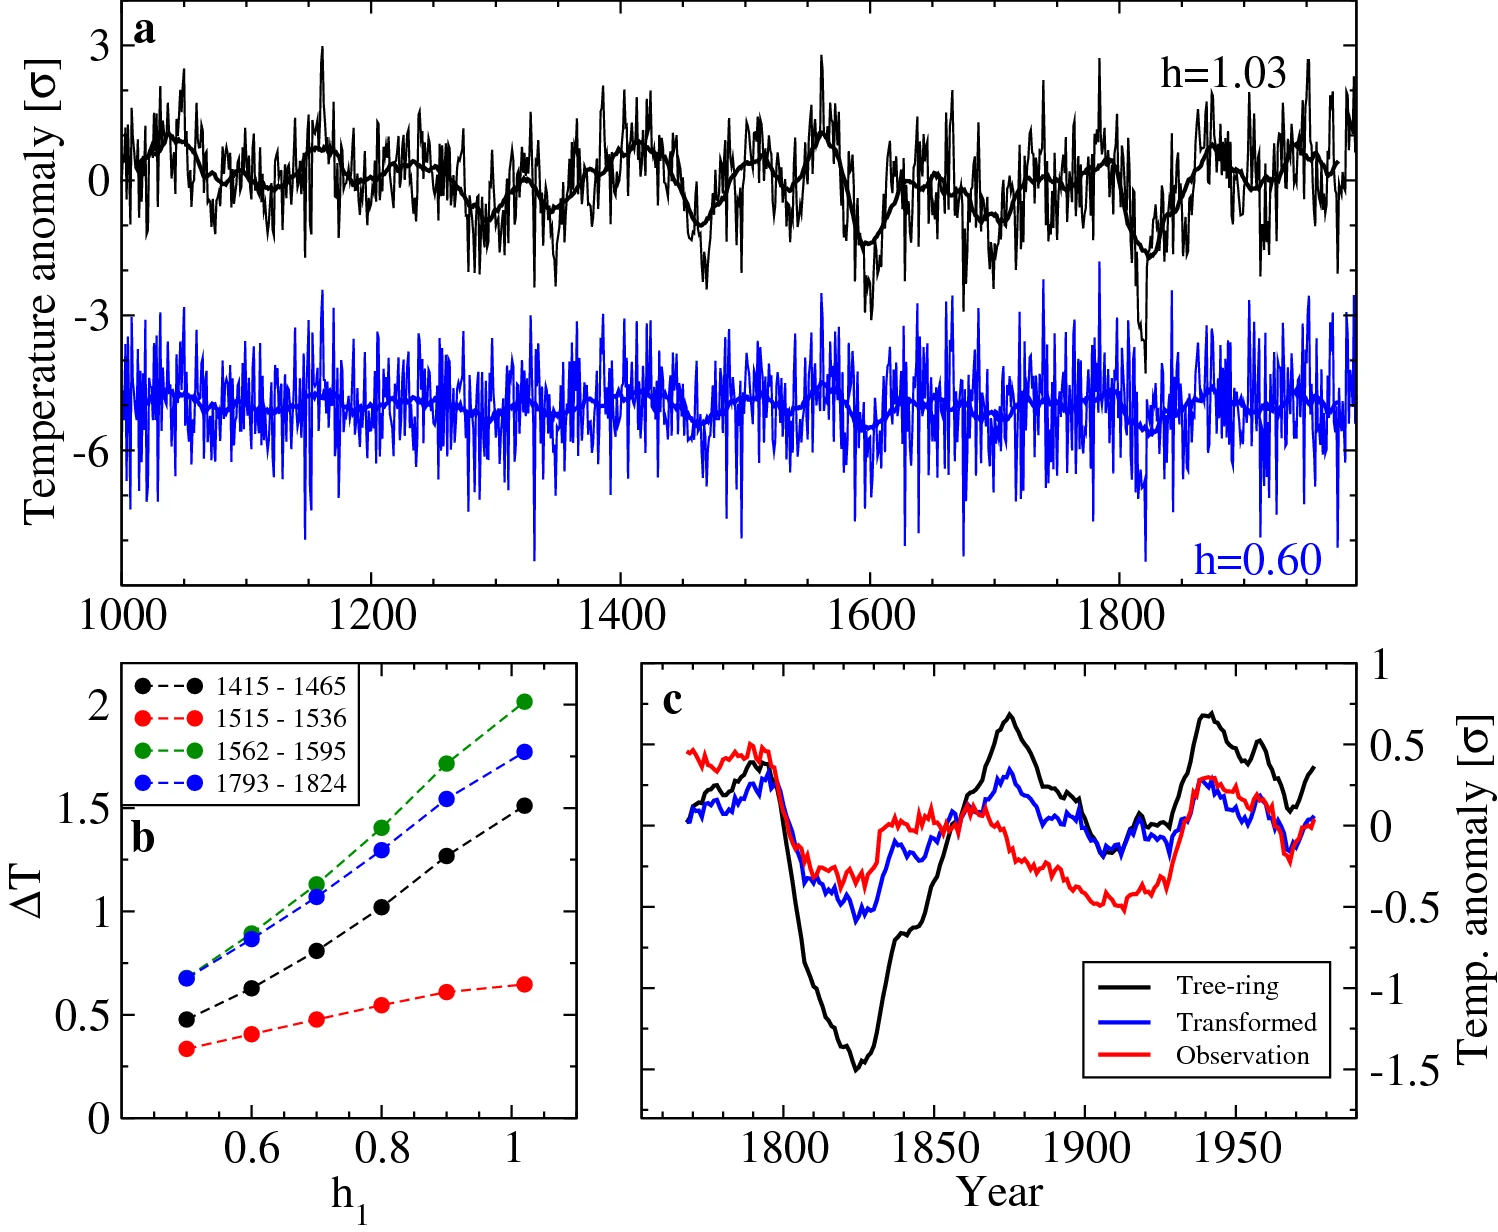
Original and transformed tree-ring proxy temperature record. a Compares the original TRBR record for the period 1000–1990, where the Hurst exponent h is 1.03 (black), with the transformed TRBR record, where h≡h1=0.6 (blue). For better visibility, the transformed TRBR record has been shifted downward by 5 units of its standard deviation. b How the magnitudes of the cold periods in the transformed TRBR record decrease with decreasing Hurst exponent h1. The magnitudes are quantified by the differences of the 30 year moving averages between the beginning and the end of the respective periods. c Compares the 30-year moving averages of the original and the transformed TRBR record (h=0.6) with the 30-year moving average of the observational temperatures from Switzerland. The comparison shows that the transformed TRBR record fits quite nicely with the observational data
To see how the strength of the long-term variations in the transformed TRBR data depends on their Hurst exponent h1h1, we have determined, in the 30-year moving average, the temperature differences in 4 periods (1415–1465, 1515–1536, 1562–1595, 1793–1824) where the greatest changes between 1350 and 1950 occur. The result is shown in Fig. 4b. The figure shows that the temperature difference between the beginning and the end of each period decreases continuously with decreasing h. For h around 0.6, the temperature differences are roughly halved.
Conclusion
Since tree ring-based reconstructions play an important role in the understanding of past temperature variability, we suggest the use of the Hurst exponent as a standard practice to assess the reconstructions’ low-frequency properties and to compare the determined values with the Hurst exponents of other respective time series (observational, harvest dates, models). If deviations from the expected values are detected, the data should be transformed to adjust the Hurst exponent. This will lead to a more realistic reconstruction of the record’s low-frequency signal and thus to a better understanding of the climate variations of the past.
My Comment
Wow! Just Wow! The Mann-made Hockey Stick was found bogus because it was produced by grafting a high-resolution instrumental temperature record on top of a low-resolution tree ring proxy record. Now climatists want to erase four bumps in the Medieval period lest they appear comparable to contemporary temperatures sampled minute by minute. A simple tweaking of a formula achieves the desired result. Fluctuations which were decadal are now smoothed and cannot compete with modern annual and monthly extremes. Well done! (extreme snark on)
Background: See Return of the Hockey Stick


The same charlatans increasing the death rate by pushing antinuclear hysteria in the 70s and 80s today with no exceptions push Misanthropic Global Warmunism straight out of a 1961 Soviet storyboard predicting the year 2017–complete with sharknados!
LikeLike
That last C graph reminds me of a Youtube video talking about how NASA appears to have reduced the high temperatures in the 1940s to make the present day seem higher.
Part 1
Part 2
LikeLike
The important lesson here, I think, is that these zealots never give up. They have a permanent bee-in-their-bonnet that impels them on, apparently forever.
Now for the interesting questions:
Is this some sort of ego-defense? (And what exactly does that mean?) To what degree is egotism, vanity required for such behavior? Or is it the degree of commitment to a hypothesis? (But what determines that?) Or the centrality of the hypothesis to a ‘world-view? How does one get at the psychology involved here?
And what about the social psychological/sociological side of this? It looks like there is some sort of social network now in place that facilitates exercises like this* – how should developments like this be characterized?
*(which would account for the “McIntyre Effect”, i.e.that a questionable piece of work passes through peer-review and is published, only to be thoroughly discredited subsequently by ‘outside’ critical analysis)
LikeLike
rw, IMO it is a situation where a relatively small cadre of activist scientists took over the field of climatology and promoted a new paradigm. The climategate emails show who and how they operated then and now. They gained a monopoly on the field and funding for research and publication. The rewards were multi-dimensional: professional awards, status, celebrity, grants, stipends, investments. Too much to lose to climb back down, and anyway the evidence is as malleable as a rohrschach test. They are on the verge of winning they think: papers like this are just plugging a few inconvenient holes to keep the science settled. The battleground is socio-political. As Trump says: They’re after you; I’m only in their way.
LikeLike
Except that they have to believe what they’re doing. Mosher & Fuller in their Climategate book got it right, I think. Your explanation is partly true, but it isn’t just a matter of power, status, etc (the standard tropes, I might add). After all, these guys (even Mikey) have some sense that there are true and false propositions. And if what they’ve claimed is false, then they’re a bunch of clowns of historical proportions.
What we’re seeing in the Climategate emails is a lot of what is loosely called “cognitive dissonance”. Before McIntyre came along, I really don’t think they thought they were doing something that could be severely criticized – despite all the corners cut and so forth. (Recall how helpful Jones was to McIntyre before 2003.) Part of this is probably a matter of quality of mind – they’re reasonably bright guys, but they aren’t quite bright enough to size up the situation properly, to put it in proper perspective. In fact, if they could do that they would never have embarked on such a dubious project – to take awful data with all the corruptions and to try to massage it into something good enough to reflect the influence of a tiny increase in the concentration of a trace gas.That’s the folly of minds that are second-rate.
And they themselves are not especially “socio-political” – that comes with the “widening gyres” of the AGW episode. Their efforts have been made into something socio-political to be sure, but it’s not really their doing. In other words, to understand that aspect of AGW, you have to look at the way the various stakeholders interact with each other, and the way the resulting system develops – then it becomes very, very interesting. (This, incidentally, gets into what I called in an earlier essay (on Mark Steyn’s book) the “group mind”, i.e. a kind of intelligence that emerges from social interactions.)
In other words, I don’t think the rather crude intentional/dramaturgical model that you present does justice to the actual causes and effects.
LikeLike
Relax rw, my comment was in support of yours, not an attempt to refute it.
LikeLike