
H/T to Ireneusz Palmowski for pointing me to this presentation of a paper Regional and temporal variability of solar activity and galactic cosmic ray effects on the lower atmosphere circulation by S. Veretenenko and M. Ogurtsov Advances in Space Research · February 2012.
Background
A previous post Quantifying Natural Climate Change presented a study by Dan Pangburn demonstrating that earth temperature fluctuations can be explained by oceanic and solar variations. The oceanic factors are elaborated in numerous posts here under the category Oceans Make Climate. The solar mechanisms are more mysterious, making it more difficult to show how solar activity influences cooler or warmer eras. Cosmoclimatology is a theory advanced by Svensmark that draws a connection between GCRs (Galactic Cosmic Rays) and cloudiness.
 This post presents evidence from Russian scientists describing how those same Cosmic Rays (GCR) have a dramatic top-down effect on atmospheric circulation by interacting with ozone in the stratosphere. The basic idea is that the climate effects from increasing cosmic rays vary according to Arctic polar vortex shifts from fast and strong, to weak and wavy, resulting in alternating climate epochs.
The published paper can be accessed by the linked title at the top. The slide presentation is here.

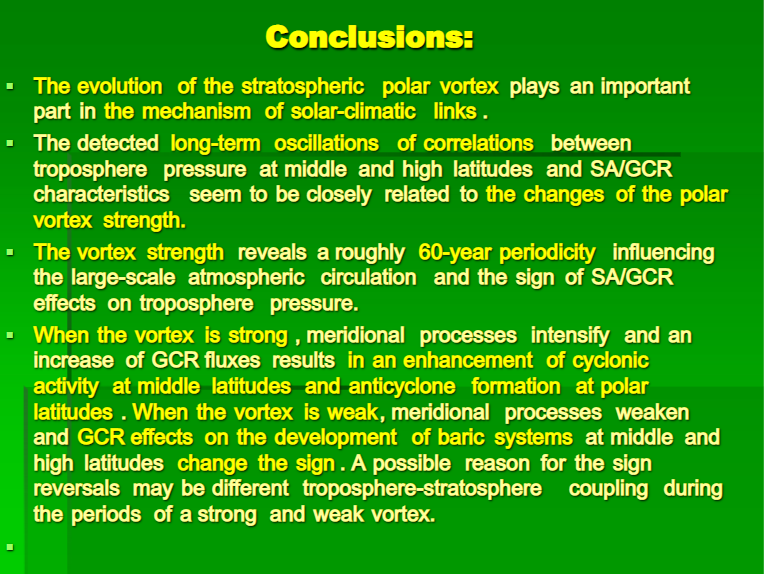
Conclusions: In the paper three important findings are described. Text in italics with my bolds.
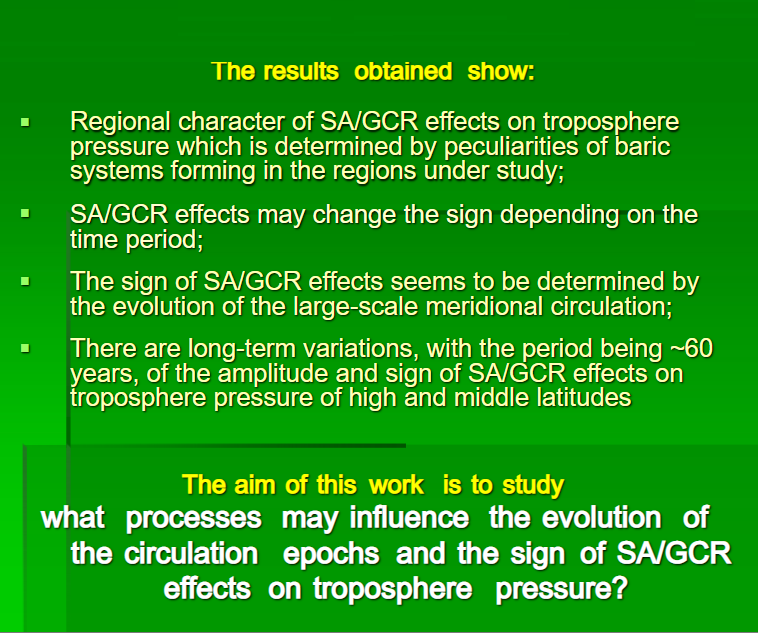
1. Disturbances of the lower atmosphere circulation associated with solar activity and galactic cosmic ray variations take place over the entire globe, with the processes developing in different latitudinal belts and regions being closely interconnected. The SA/GCR effects on pressure variations reveal a distinct latitudinal and regional character depending on the circulation peculiarities in the regions under study. The spatial structure of pressure variations correlated with SA/GCR variations is closely related to their influence on the main elements of the large-scale atmospheric circulation, namely on the polar vortex, planetary frontal zones and extratropical cyclones and anticyclones.
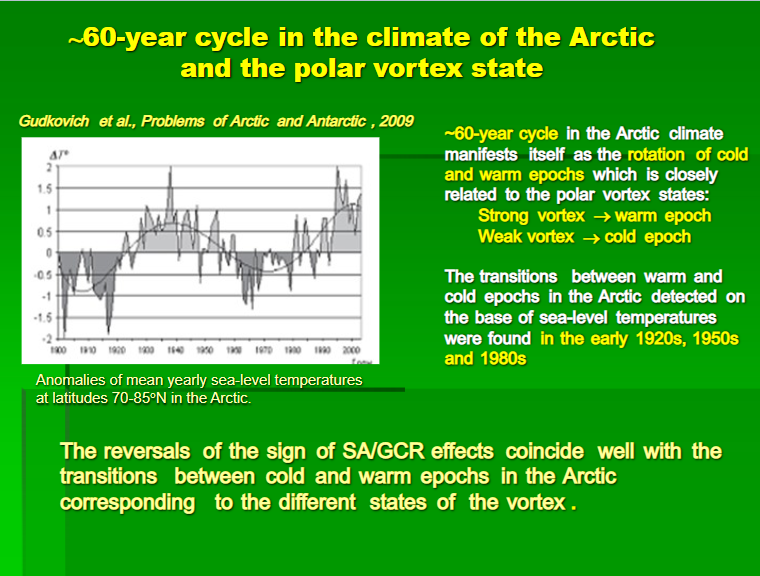
2. The temporal structure of the SA/GCR effects on pressure variations at high and middle latitudes of the Northern hemisphere is characterized by a pronounced ~60-year periodicity which is apparently related to the epochs of the large-scale atmospheric circulation. The reversals of the correlation sign between pressure and sunspot numbers were detected in the 1890s, 1920s, 1950s and in the early 1980s. The sign of the SA/GCR effects seems to depend on the evolution of meridional processes in the atmosphere which, in turn, is determined by the state of the polar vortex.
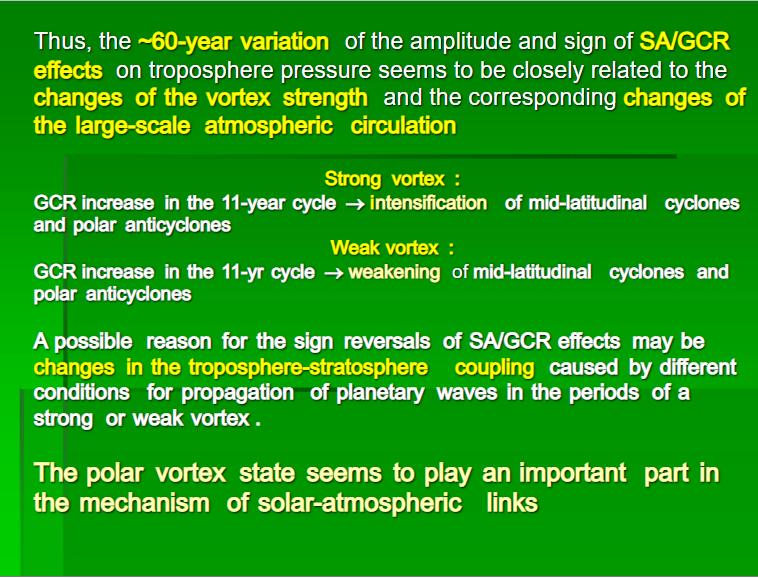
3. A mechanism of SA/GCR influences on the troposphere circulation is likely to involve changes in the evolution of the polar vortex in the stratosphere of high latitudes. Intensification of the polar vortex associated with solar activity and cosmic ray variations may contribute to the increase of temperature contrasts in planetary frontal zones and, then, to the intensification of extratropical cyclogenesis.

Comment and Further Discussion
It takes some effort to grasp the import of this research. If I understand correctly, they looked at the impact of increasing GCRs during periods of quiet SA, and found the effects on earth atmosphere differed depending on another factor: strength or weakness of the polar vortex, which is an internal feature of the Arctic region. At one point, the paper says:
Vangengeim–Girs classification defines three main forms of circulation: the westerly (zonal) form W, the easterly form E and the meridional form C. A distinguishing feature of the form W is the development of zonal circulation when the pressure field is characterized by small amplitude waves rapidly moving from west to east. The forms C and E are characterized by the development of meridional processes in the atmosphere when slowly moving or stationary large-amplitude waves are observed in the pressure field.

Fig. 9. Top panel: annual frequencies of occurrence (number of days during a year) of the main forms of the large-scale circulation (20-year running averages) (a); Bottom panel: correlation coefficient R(SLP,Rz) between mean yearly values of pressure in the region of the polar vortex center and sunspot numbers for sliding 17-year periods (b) and the Fourier spectrum of the annual frequency of occurrence of the meridional circulation C (c). The vertical dotted lines indicate the moments of the correlation sign reversals.
The data in Fig. 9a show the evolution of annual frequency of occurrence (expressed as a number of days during a year) of these circulation forms. The time variation of the correlation R(SLP,Rz) in the region of the Arctic polar vortex is presented in Fig. 9b. Comparing these data, we can see that the latest reversal of the correlation sign in the early 1980s was preceded by noticeable changes in the evolution of all the circulation forms. Since the late 1970s the frequency of occurrence of the zonal form W has been increasing. The frequency of the meridional form C started increasing too, with a simultaneous decrease of the frequency of the form E.
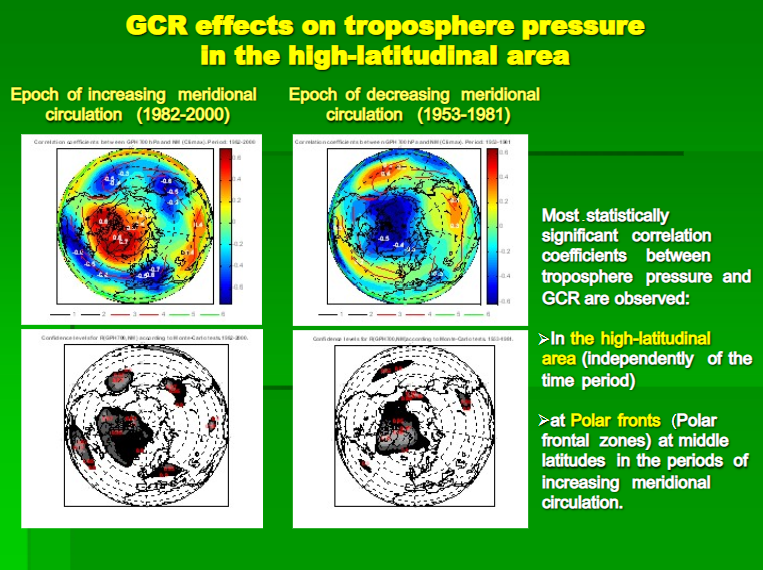
The results presented in Fig. 9 show that the time behavior of the correlation between pressure at high and middle latitudes and SA/GCR variability depends on the evolution of meridional processes in the atmosphere. In the epochs of increasing frequency of the meridional circulation C (~1920–1950 and since the 1980s) we can see that an increase of GCR fluxes in the 11-year solar cycle is accompanied by an intensification of polar anticyclones (an increase of the troposphere pressure at polar latitudes), an intensification of extratropical cyclogenesis (a decrease of pressure at polar fronts at middle latitudes) and a weakening of the equatorial trough (an increase of pressure at low latitudes). The long-term GCR effects on extratropical cyclogenesis during these epochs are in good agreement with the GCR effects on the development of baric systems detected on the time scale of a few days. These epochs coincide with the periods of a strong polar vortex.
In the epochs of decreasing meridional circulation C (~1890–1920 and ~1950–1980), corresponding to a weak polar vortex, we observe the spatial distribution of the correlations between the troposphere pressure and GCR intensity with the opposite sign: an increase of GCR isaccompanied by a weakening of polar anticyclones, a weakening of extratropical cyclogenesis and an intensification of the equatorial trough.
A possible reason for these correlation reversals may be significant changes in a dynamic coupling between the troposphere and the stratosphere during the periods of a weak and strong polar vortex. According to the data of Perlwitz and Graf (2001), the stratosphere may influence the troposphere only when the polar vortex is strong. When the vortex is weak, only the troposphere influences the stratosphere. So, if GCR (or some other factor of solar activity) produce any effect in the stratosphere in the period of a strong vortex (i.e., in the period of increasing meridional circulation), this effect may be transferred to the troposphere and we can see a pronounced correlation of extratropical cyclogenesis with GCR intensity. As the strength of the vortex reveals ~60-year variations (Gudkovich et al., 2009; Frolov et al., 2009), which influence the circulation state, this can explain the detected temporal variability of the SA/GCR effects.
And thus we can appreciate the summary slide shown at the top. It would appear that we have been in a period of weak and wavy polar vortices as well as strong GCRs (minimal solar activity), a continuation of the epoch since 1982 (on the left). It also suggests that the ~60 year vortex cycle is due for a shift to the epoch on the right.

Reblogged this on Climate Collections.
LikeLike
Thanks.
LikeLike