 Previous posts showed 2020 Arctic Ice breaking the 15M km2 ceiling, while wondering whether the ice will have staying power. “Yes” is the answer, at least through the first third of March.
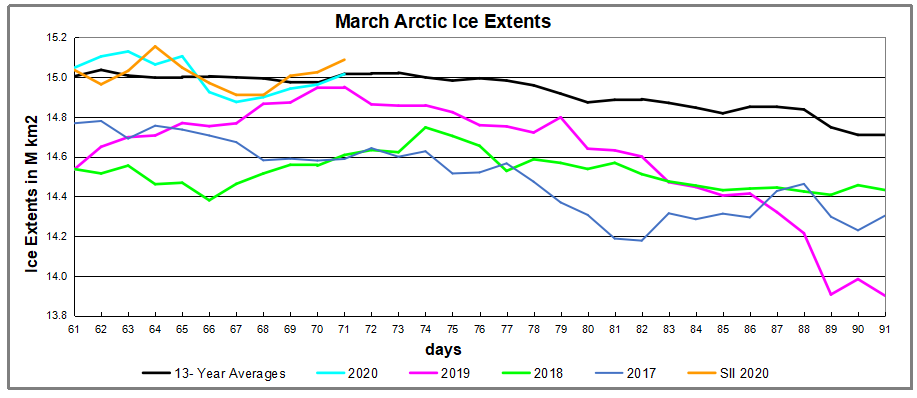
By end of February, ice extent this year was well above the 13- year average, then dipped lower before growing again surplus to average and other recent years. This is important since March monthly average is considered the ice extent maximum for the year. Note also the SII is matching and currently exceeding the MASIE estimates.

The chart below shows the distribution of ice across the various regions comprising the Arctic zone.
| Region | 2020071 | Day 071 Average | 2020-Ave. | 2018071 | 2020-2018 |
| (0) Northern_Hemisphere | 15015552 | 15016528 | -976 | 14608334 | 407218 |
| (1) Beaufort_Sea | 1070655 | 1070115 | 540 | 1070445 | 210 |
| (2) Chukchi_Sea | 966006 | 965984 | 22 | 966006 | 0 |
| (3) East_Siberian_Sea | 1087137 | 1087135 | 3 | 1087137 | 0 |
| (4) Laptev_Sea | 897845 | 897645 | 200 | 897845 | 0 |
| (5) Kara_Sea | 930542 | 923821 | 6721 | 933916 | -3374 |
| (6) Barents_Sea | 658816 | 625730 | 33086 | 679863 | -21047 |
| (7) Greenland_Sea | 617321 | 624974 | -7654 | 526061 | 91259 |
| (8) Baffin_Bay_Gulf_of_St._Lawrence | 1516513 | 1597523 | -81010 | 1488350 | 28163 |
| (9) Canadian_Archipelago | 854282 | 852766 | 1517 | 853109 | 1174 |
| (10) Hudson_Bay | 1260903 | 1259848 | 1055 | 1260838 | 66 |
| (11) Central_Arctic | 3248013 | 3215629 | 32384 | 3172178 | 75835 |
| (12) Bering_Sea | 818900 | 738395 | 80505 | 401469 | 417431 |
| (13) Baltic_Sea | 14681 | 87191 | -72510 | 130767 | -116086 |
| (14) Sea_of_Okhotsk | 1062110 | 1048073 | 14037 | 1120721 | -58611 |
As of yesterday, Day 2020071 matches the NH 13-year average and also most regions. Two deficits to average are in Baffin Bay and Baltic Sea, offset by surpluses in Bering and Okhotsk, as well as Central Arctic and Barents Sea. Note current Bering Sea ice is twice the extent in 2018.


Reblogged this on Climate Collections.
LikeLike