
nzrobin commented on my previous post Big Wind Blacklisted that he had more to add. So this post provides excerpts from a 7 part series Anthony wrote at kiwithinker on Electric Power System Stability. Excerpts are in italics with my bolds to encourage you to go read the series of posts at kiwithinker.
1. Electrical Grid Stability is achieved by applying engineering concepts of power generation and grids.
Some types of generation provide grid stability, other types undermine it. Grid stability is an essential requirement for a power supply reliability and security. However there is insufficient understanding of what grid stability is and the risk that exists if stability is undermined to the point of collapse. Increasing grid instability will lead to power outages. The stakes are very high.
2.Electric current is generated ‘on demand’. There is no stored electric current in the grid.
The three fundamental parts of a power system are:
its generators, which make the power,
its loads, which use the power, and
its grid, which connects them together.
The electric current delivered when you turn on a switch is generated from the instant you operate the switch. There is no store of electric current in the grid. Only certain generators can provide this instant ‘service’.
So if there is no storage in the grid the amount of electric power being put into the grid has to very closely match that taken out. If not, voltage and frequency will move outside of safe margins, and if the imbalance is not corrected very quickly it will lead to voltage and frequency excursions resulting in damage or outages, or both.
3. A stable power system is one that continuously responds and compensates for power/ frequency disturbances, and completes the required adjustments within an acceptable timeframe to adequately compensate for the power/frequency disturbances.
Voltage is an important performance indicator and it should of course be kept within acceptable tolerances. However voltage excursions tend to be reasonably local events. So while voltage excursions can happen from place to place and they cause damage and disruption, it turns out that voltage alone is not the main ‘system wide’ stability indicator.
The key performance indicator of an acceptably stable power system is its frequency being within a close margin from its target value, typically within 0.5 Hz from either 50 Hz or 60 Hz, and importantly, the rise and fall rate of frequency deviations need to be managed to achieve that narrow window.
An increasing frequency indicates more power is entering the system than is being taken out. Likewise, a reducing frequency indicates more is being taken out than is entering. For a power supply system to be stable it is necessary to control the frequency. Control systems continuously observe the frequency, and the rate of change of the frequency. The systems control generator outputs up or down to restore the frequency to the target window.
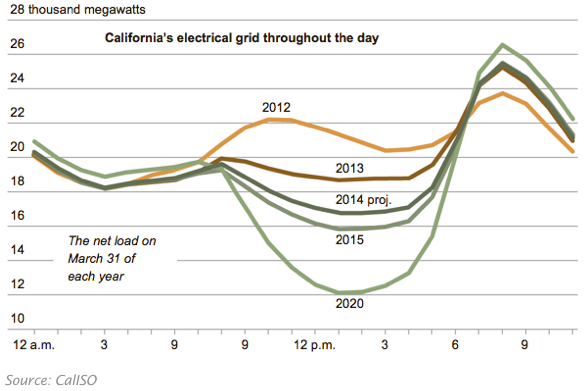
Of course energy imbalances of varying size are occurring all the time. Every moment of every day the load is continuously changing, generally following a daily load curve. These changes tend to be gradual and lead to a small rate of change of frequency. Now and then however faults occur. Large power imbalances mean a proportionately faster frequency change occurs, and consequently the response has to be bigger and faster, typically within two or three seconds if stability is to be maintained. If not – in a couple blinks of an eye the power is off – across the whole grid.
If the system can cope with the range of disturbances thrown at it, it is described as ‘stable’. If it cannot cope with the disturbances it is described as ‘unstable’.
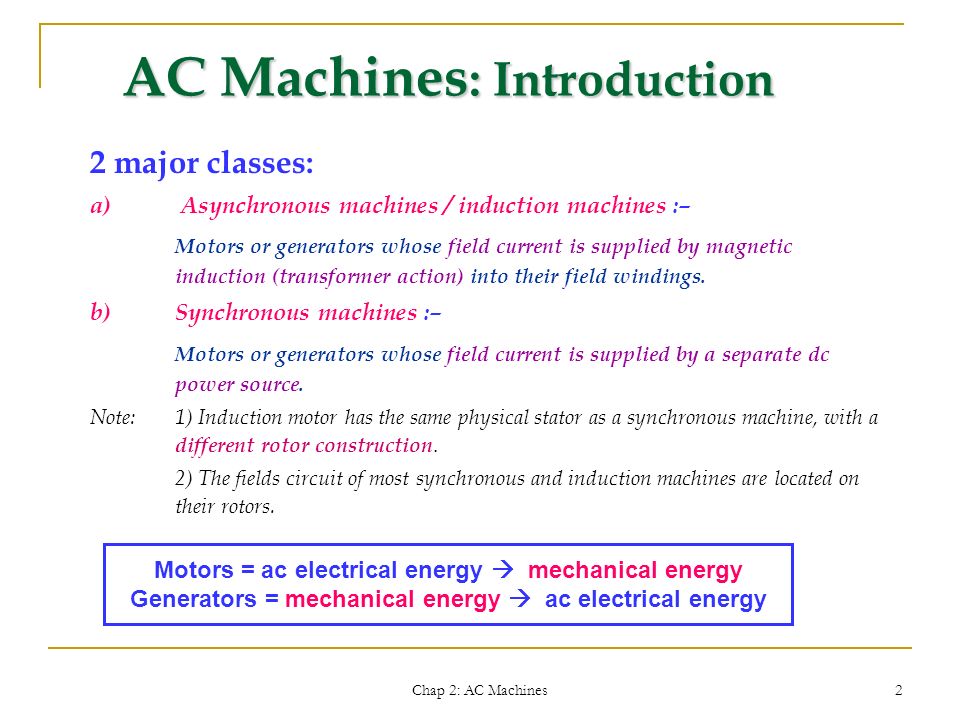
4.There are two main types of alternating current machines used for the generation of electricity; synchronous and asynchronous. The difference between them begins with the way the magnetic field of the rotor interacts with the stator. Both types of machine can be used as either a generator or motor.
There are two key differences affecting their contribution to stability.
The kinetic energy of the synchronous machine’s rotor is closely coupled to the power system and therefore available for immediate conversion to power. The rotor kinetic energy of the asynchronous machine is decoupled from the system by virtue of its slip and is therefore not easily available to the system.
Synchronous generators are controllable by governors which monitor system frequency and adjust prime mover input to bring correction to frequency movements. Asynchronous generators are typically used in applications where the energy source is not controllable, eg: wind turbines. These generators cannot respond to frequency movements representing a system energy imbalance. They are instead a cause of energy imbalance.
Short -term stability
The spinning kinetic energy in the rotors of the synchronous machines is measured in megawatt seconds. Synchronous machines provide stability under power system imbalances because the kinetic energy of their rotors (and prime movers) is locked in synchronism with the grid through the magnetic field between the rotor and the stator. The provision of this energy is essential to short duration stability of the power system.
Longer-term stability
Longer term stability is managed by governor controls. These devices monitor system frequency (recall that the rate of system frequency change is proportional to energy imbalance) and automatically adjust machine power output to compensate for the imbalance and restore stability.
5.For a given level of power imbalance the rate of rise and fall of system frequency is directly dependent on synchronously connected angular momentum.
The rotational form of Newton’s second law of motion; Force = Mass * Acceleration describes the power flow between the rotating inertia (rotational kinetic energy) of a synchronous generator and the power system. It applies for the first few seconds after the onset of a disturbance, i.e.: before the governor and prime mover have had opportunity to adjust the input power to the generator.
Pm – Pe = M * dw/dt
Pm is the mechanical power being applied to the rotor by the prime mover. We consider this is a constant for the few seconds that we are considering.
Pe is the electrical power being taken from the machine. This is variable.
M is the angular momentum of the rotor and the directly connected prime mover. We can also consider M a constant, although strictly speaking it isn’t constant because it depends on w. However as w is held within a small window, M does not vary more than a percent or so.
dw/dt is the rate of change of rotor speed, which relates directly to the rate of increasing or reducing frequency.
The machine is in equilibrium when Pm = Pe. This results in dw/dt being 0, which represents the rotor spinning at a constant speed. The frequency is constant.
When electrical load has been lost Pe is less than Pm and the machine will accelerate resulting in increasing frequency. Alternatively when electrical load is added Pe is greater than Pm the machine will slow down resulting in reducing frequency.
Here’s the key point, for a given level of power imbalance the rate of rise and fall of system frequency is directly dependent on synchronously connected angular momentum, M.
It should now be clear how central a role that synchronously connected angular momentum plays in power system stability. It is the factor that determines how much time generator governors and automatic load shedding systems have to respond to the power flow variation and bring correction.

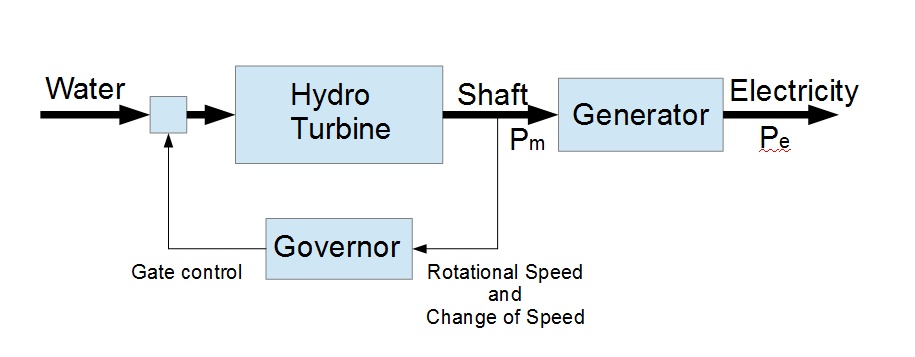
6 .Generation Follows Demand. The machine governor acts in the system as a feedback controller. The governor’s purpose is to sense the shaft rotational speed, and the rate of speed increase /decrease, and to adjust machine input via a gate control.
The governor’s job is to continuously monitor the rotational speed w of the shaft and the rate of change of shaft speed dw/dt and to control the gate(s) to the prime mover. In the example below, a hydro turbine, the control applied is to adjust the flow of water into the turbine, and increasing or reducing the mechanical power Pm compensate for the increase or reduction in electrical load, ie: to approach equilibrium.
It should be pointed out that while the control systems aim for equilibrium, true equilibrium is never actually achieved. Disturbances are always happening and they have to compensated for continuously, every second of every minute of every hour, 24 hours a day, 365 days a year, year after year.
The discussion has been for a single synchronous generator, whereas of course the grid has hundreds of generators. In order for each governor controlled generator to respond fairly and proportionately to a network power imbalance, governor control is implemented with what is called a ‘droop characteristic’. Without a droop characteristic, governor controlled generators would fight each other each trying to control the frequency to its own setting. A droop characteristic provides a controlled increase in generator output, in inverse proportion to a small drop in frequency.
In New Zealand the normal operational frequency band is 49.8 to 50.2 Hz. An under frequency event is an event where the frequency drops to 49.25 Hz. It is the generators controlled by governors with a droop characteristic that pick up the load increase and thereby maintain stability. If it happens that the event is large and the governor response is insufficient to arrest the falling frequency, under frequency load shedding relays turn off load.
Here is a record of an under frequency event earlier this month, where a power station tripped.
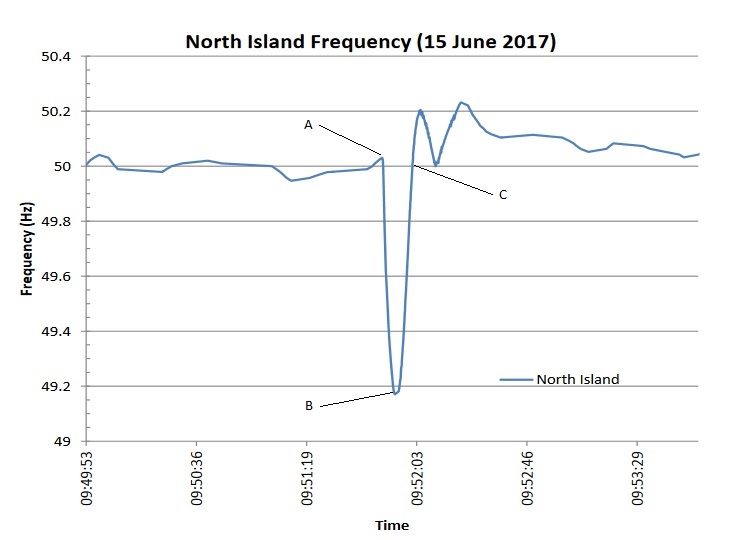
The generator tripped at point A which started the frequency drop. The rate of drop dw/dt is determined by size of the power imbalance divided by the synchronous angular momentum (Pm – Pe)/M. In only 6 seconds the frequency drop was arrested at point B by other governor controlled generators and under frequency load shedding, and in about 6 further seconds additional power is generated, once again under the control of governors, and the frequency was restored to normal at point C. The whole event lasting merely 12 seconds.
So why would we care about a mere 12 second dip in frequency of less than 1 Hz. The reason is that without governor action and under frequency load shedding, a mere 12 second dip would instead be a complete power blackout of the North Island of New Zealand.

Local officials standing outside substation Masterton NZ .
7.An under frequency event on the North Island of New Zealand demonstrates how critical is electrical system stability.
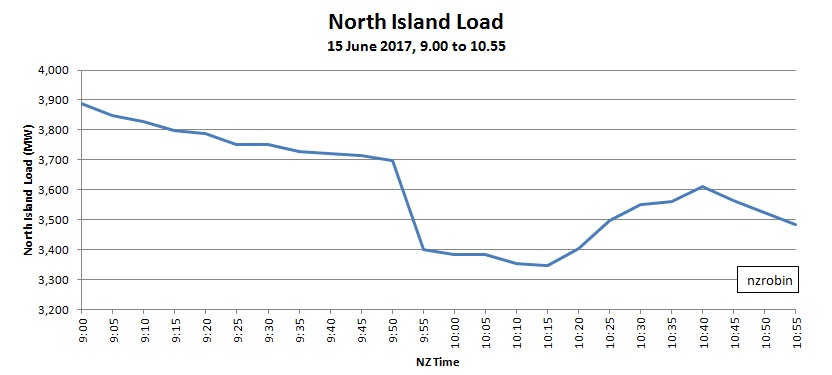
The graph below which is based on 5 minute load data from NZ’s System Operator confirms that load shedding occurred. The North Island load can be seen to drop 300 MW, from 3700 MW at 9.50 to 3400 MW at 9.55. The load restoration phase can also be observed from this graph. From 10.15 through 10.40 the shed load is restored in several steps.
The high resolution data that we’ll be looking at more closely was recorded by a meter with power quality and transient disturbance recording capability. It is situated in Masterton, Wairarapa, about 300 km south of the power station that tripped. The meter is triggered to capture frequency excursions below 49.2 Hz. The graph below shows the captured excursion on June 15th. The graph covers a total period of only one minute. It shows the frequency and Masterton substation’s load. I have highlighted and numbered several parts of the frequency curve to help with the discussion.
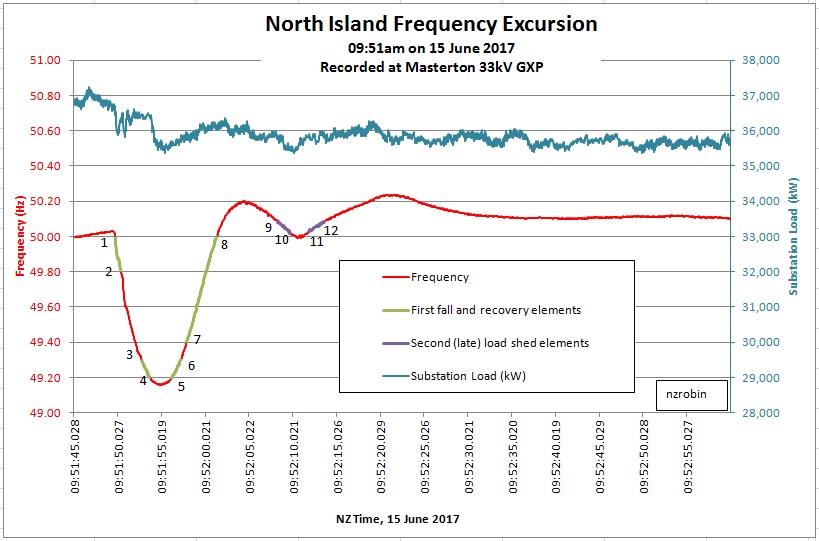
The first element we’ll look at is element 1 to 2. The grid has just lost 310 MW generation and the frequency is falling. No governors nor load shedding will have responded yet. The frequency falls 0.192 Hz in 0.651 seconds giving a fall rate df/dt of -0.295 Hz/s. From this df/dt result and knowing the lost generation is 310 MW we can derive the system angular momentum M as 1,052 MWs/Hz from -310 = M * -0.295.
It is interesting (and chilling) to calculate how long it would take for blackout to occur if no corrective action is taken to restore system frequency and power balance. 47 Hz is the point where cascade tripping is expected. Most generators cannot operate safely below 47 Hz, and under frequency protection relays disconnect generators to protect them from damage. This sets 47 Hz as the point at which cascade outage and complete grid blackout is likely. A falling frequency of -0.295 Hz/s would only take 10.2 seconds to drop from 50 to 47 Hz. That’s not very long and obviously automated systems are required to arrest the decline. The two common automatic systems that have been in place for decades are governor controlled generators and various levels of load shedding.
The fall arrest between 4 and 5 has been due to automatic load shedding. New Zealand has a number of customers contracted to disconnect load at 49.2 Hz. From these figures we can estimate a net shed load of 214 MW (114 MW + 100 MW).
From 7 to 8 the frequency is increasing with df/dt of 0.111 Hz/s and the system has a surplus of 117 MW of generation. At point 8 the system reached 50 Hz again, but the system then over shoots a little and governor action works to reduce generation to control the overshoot between 8 and 9.
This analysis shows how system inertia, under frequency load shedding and governor action work together to maintain system stability.
Summary: The key points
- The system needs to be able to maintain stability second by second, every minute, every hour, every day, year after year. Yet when a major disturbance happens, the time available to respond is only a few seconds.
- This highlights the essential role of system inertia in providing this precious few seconds. System inertia defines the relationship between power imbalance and frequency fall rate. The less inertia the faster the collapse and the less time we have to respond. Nearly all system inertia is provided by synchronous generators.
- Control of the input power to the generators by governor action is essential to control frequency and power balance, bringing correction to maintain stability. This requires control of prime mover, typically this is only hydro and thermal stations.
- When the fall rate is too fast for governor response, automatic load shedding can provide a lump of very helpful correction, which the governors later tidy up by fine tuning the response.


Question – Proponents of energy storage talk about the advantages of batteries to stabilize the grid. How does that work?
LikeLike
Roger, in theory batteries would allow surplus generation from wind and solar to be stored during low load times and added to the grid to meet high demand. In practice, there are problems with the scale of MW needed and the huge cost of lithium and short battery lifetimes.
https://www.technologyreview.com/s/611683/the-25-trillion-reason-we-cant-rely-on-batteries-to-clean-up-the-grid/
LikeLiked by 1 person
Reblogged this on Climate Collections.
LikeLike
Reblogged this on Climate- Science.press.
LikeLike