
A previous post (reprinted further on) took issue with climatists exploiting fear of flooding in Philly. This post adds more context disputing these attempts to blame urban flooding on sea level rise and to claim reducing CO2 emissions provides some sort of protection.
Background
Hydro engineers know that urban flooding is a complex problem with multiple factors beyond the effect from sea level. This paper by James Andrew Griffiths et al. presents the situation faced by all coastline cities: Modelling the impact of sea-level rise on urban flood probability in SE China. Excerpts in italics with my bolds
Estimating the likelihood of flooding in urban areas poses a greater challenge than in natural landscapes as land-surfaces are more heterogeneous and consist of many more runoff pathways. Data acquisition and process identification are also more difficult in urban areas as networks undergo more frequent and rapid change. To reduce complexity therefore, a lumped-parameter model can be used to represent hydrologically connected areas, rather than individual streets.
This diagram presents the typical situation.
The drainage systems of cities on China’s East coast generally consist of networks of channels or canals that are fed by streams from the surrounding catchments. The canal network is protected from tidal intrusion by a combination of sluice-gates, weirs and large flood-gates. Water is released from the system between high tides until a minimum water level is reached. If catchment runoff exceeds the rate of drainage from the system (for example during extreme rainfall) there is a risk of canal capacity exceedance and flooding. During normal operating conditions, a minimum water-level is preserved in canals to ensure sufficient water for irrigation, recreation or commercial use.
In summary, Urban drainage systems in coastal cities in SE China are characterized by often complex canal and sluice-gate systems that are designed to safely drain pluvial flooding whilst preventing tidal inundation. However, the risk of coastal flooding in the region is expected to increase over the next 50–100 years, as urban areas continue to expand and sea-levels are expected to rise. To assess the impact of projected sea-level rise on this type of urban drainage system, a one-dimensional model and decision support tool was developed. The model indicated that although sea-level rise represents a significant challenge, flood probability will continue to be most influenced by rainfall. Events that are significant enough to cause flooding will most likely be minimally impacted by changes to the tidal frame. However, it was found that a sea-level rise of up to 1.2 m by 2010 would result in increased drainage times and higher volumes of over-topping when flooding occurs.
Philadelphia is a Career Flood Fighter
Just like Rocky Balboa atop the Art Museum steps, Philadelphia has long contended with flood events and has always to be prepared. There have been 65 Philly floods since 1769, most recently in 2014. The city floods when water level in the Schuylkill basin goes over 11 feet, according to Historical Floods: Schuylkill River at Philadelphia, Pennsylvania from NOAA.
The table below shows the most severe events, 15 in all from 1869 to 2014, along with the crest level in feet and the measured streamflow in cubic feet per second.
| Date of Flood | Crest (ft) | Streamflow (cfs) | Category | CO2 ppm |
| 10/04/1869 | 17.00 | 135,000 | Major | 287.5 |
| 3/1/1902 | 14.80 | 98,000 | Moderate | 296.6 |
| 8/24/1933 | 14.70 | 96,200 | Moderate | 308.9 |
| 7/9/1935 | 14.10 | 82,000 | Moderate | 309.7 |
| 8/9/1942 | 13.10 | 71,500 | Moderate | 310.7 |
| 6/2/1946 | 14.57 | 94,600 | Moderate | 310.3 |
| 11/25/1950 | 14.32 | 89,800 | Moderate | 311.3 |
| 8/19/1955 | 14.32 | 90,100 | Moderate | 313.7 |
| 9/13/1971 | 13.28 | 70,300 | Moderate | 326.4 |
| 6/23/1972 | 14.65 | 103,000 | Moderate | 327.5 |
| 1/19/1996 | 13.36 | 79,000 | Moderate | 362.6 |
| 9/17/1999 | 14.10 | 92,500 | Moderate | 368.4 |
| 10/1/2010 | 13.05 | 76,300 | Moderate | 389.2 |
| 8/28/2011 | 13.56 | 83,900 | Moderate | 391.2 |
| 5/1/2014 | 13.91 | 88,300 | Moderate | 397.2 |
I have also provided the CO2 atmospheric concentrations for the flood dates, as reported by NASA. Climatists advocate reducing CO2 emissions as a policy to prevent urban flooding. However, the correlation between CO2 in ppm and Philly flood crests is -.58 and -.42 with streamflow. So the severity of Philly flooding has decreased while CO2 has risen. Perhaps burning more fossil fuels would be the prudent action.
Why Philadelphia is Prone to Flooding
BillyPenn explains Why Philadelphia floods so easily when it rains. Excerpts in italics with my bolds.
Mahbubur Meenar, a professor of community and regional planning at Temple, says that much of the flooding we see happens because of the city’s drainage system. In about 2/3 of the city, stormwater and wastewater — whatever comes out of your house or office building — drains through the same system. This happens because, well, the city is old. It’s so old, and so ingrained in the city’s infrastructure that it would be prohibitively expensive, if not impossible, to change.
On normal days, the drainage system works fine. Wastewater goes through and is treated before making its way to one of the rivers. But rain throws a wrench into the process. It flows into the same drains and mixes with the wastewater. The extra water can rise and flow onto the streets. Litter and fallen leaves don’t help, either. They can gather in the drains and make it more likely for flooding.
Another variable: Especially around Center City there are few natural resources that can capture water, i.e. streams and creeks. Nearly all of them have been filled in and turned into sewers. Dock Street is probably the best known example. That brick street in Society Hill used to be a creek. Dozens more have experienced the same fate, mostly in Center City and the neighborhoods closest to it. Check it out. The red lines indicate former bodies of water that have been filled in:

Creeks Flood Philly PHILLYH2O.ORG
If those creeks were still around, they could collect rainwater. Without them, stormwater lingers on the streets and has to go somewhere else — and in Philadelphia that’s through the drains where wastewater is already going.
“Depending on all these things,” Meenar said, “the road gets flooded.”
To some extent, there’s not much the Water Department can do. It can’t restore all of Philadelphia’s creeks or overhaul the city’s infrastructure, particularly in the oldest parts of the city where stormwater and wastewater drain together. But the Water Department is working on green stormwater infrastructure to combat the problem. There have been some inroads throughout the city’s neighborhoods — things like green roofs, rain gardens and even man-made wetlands. They are designed to collect stormwater.
The primary purpose of these measures actually has to do with keeping our rivers clean. Stormwater that hits Philly’s streets can pick up chemicals harmful to our rivers and to us if it ends up in our drinking water. By storing the stormwater for a while, it can be released into a system where it will be properly treated, rather than flowing directly into the Schuylkill or Delaware.
The secondary effect for green stormwater infrastructure is that it helps prevent flooding. Not all of the water is rushing into drains at once.
“They try to store water as long as possible and then slowly release it to the drain,” Meenar said.
So that’s how the City is dealing with flooding from rainstorms. Besides rain and severe storms, of course, Philadelphia’s 3,000 miles of leaky pipes can cause flooding, too. That’s an entirely different problem, though.
Previous Post: Philly Under Water? Not so Fast.
A previous post explained how local TV weatherpersons are being recruited to stoke public fears about global warming/climate change. See Climate Evangelists Are Taking Over Your Local Weather Forecast

For example, just today Philadelphia NBC TV affiliate aired a segment declaring Climate Change Studies Show Philly Underwater. Previously Philly CBS station had their piece shown below.
All of this fearmongering over sea level rise is a coordinated campaign to terrorize coastal dwellers and landowners. UCS (Union of Concerned Scientists) together with Climate Central are collaborating to do a drip, drip, drip water torture treatment exploiting the public addiction to television.

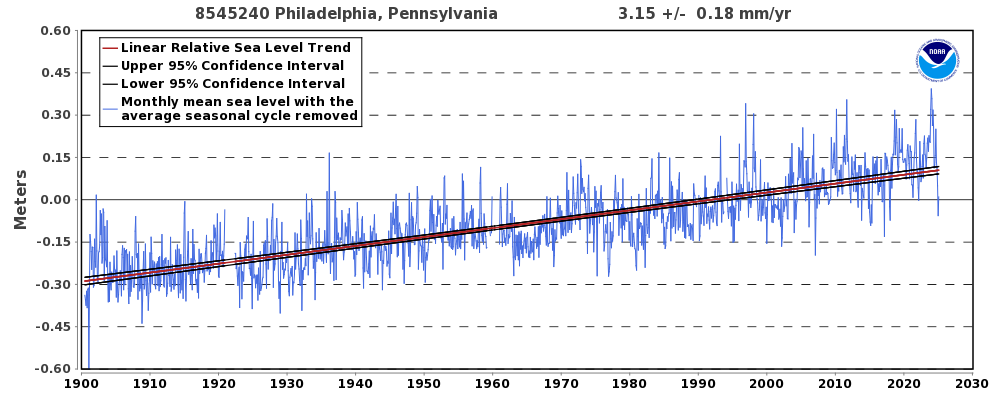
Philadelphia, PA – Station ID: 8545240
What They Are Not Telling People
From NOAA Tides and currents comes this long record of service by the tidal guage at Philadelphia.
Climate Central in 2016 published Pennsylvania and the Surging Sea, including this forecast:
In records running back to 1900, Philadelphia has never seen waterfront flooding that reaches 4 feet above the local high tide line. But under a mid-range sea level rise scenario, floods within the Delaware Estuary exceeding 4 feet are more likely than not to take place by 2040, less than one 30-year mortgage cycle away. Under a low-range scenario, chances are just below even; and under a high-range scenario, they reach 3 in 4. At the other end of the spectrum, under high-range projections, there is roughly a 4 in 5 chance of floods above 9 feet by the end of the century.
Putting the projections together with the observational record gives this graph.
 Both the record and projection are zero at year 2000. If the past trend continues, a further rise of 30 cm would be observed by 2100. If Climate Central model-based projection is true, the red line shows 122 cm rise by 2040, and 274 cm by 2100. So alarmists are projecting in 20 years, Philadelphia will get four times the rise that occurred in the last 100 years. Even now, in 2019, the projection is off by 50 cm, and observations are going down.
Not to worry, UCS provides this Disclaimer:
Neither the authors nor the Union of Concerned Scientists are responsible or liable for financial or reputational implications or damages to homeowners, insurers, investors, mortgage holders, municipalities, or other any entities. The content of this analysis should not be relied on to make business, real estate or other real world decisions without independent consultation with professional experts with relevant experience. The views expressed by individuals in the quoted text of this report do not represent an endorsement of the analysis or its results.
None of that uncertainty appears in the TV clips. And even worse, computing technology and desktop publishing are being exploited not to empower people, but to terrify them. An entire web page is devoted to Google Earth images photoshopped to show chunks of Philadelphia under water. Here’s what Philly could look like in 2100 if sea levels rise
:format(webp)/cdn.vox-cdn.com/uploads/chorus_image/image/58274155/Screen_Shot_2018_01_10_at_10.17.06_AM.0.png)
Conclusion
More and more, the media are pushing people into the Hobbesian Choice. Thomas Hobbes (1544–1631) believed that man must choose between living in a state of nature (a life which is “solitary, poor, nasty, brutish, and short”) or suffering under an arbitrary and absolute government. And the media content forces another awful decision: Either believe nothing (or the opposite) of what you read or see on TV, or go into full panic mode.
Footnote
The hottest temperatures ever reported in Phoenix came in January 2015, when Fox 10 weatherman Cory McCloskey faced a malfunctioning temperature map on live television. “Wow, 750 degrees in Gila Bend right now,” he said, without breaking a sweat. “And 1,270 in Ahwatukee. Now, I’m not authorized to evacuate, but this temperature seems pretty high.” More than 6 million people have watched the blooper on YouTube.

There have been 65 Philly floods since 1769,… context’s the thing,
one picture in isolation, one event in isolation, don’t make some grand theory
true,
LikeLike