
In one corner, Darth Vader, the Prince of CO2, filling the air with the overwhelming sound of his poison breath. Opposing him, Luke Skywalker, a single skeptic armed only with facts and logic.
OK, that’s over the top, but it’s what came to mind while reading a new paper by Nicola Scafetta in which he goes up against the IPCC empire. And Star Wars came to mind since Scafetta’s theory involves astronomical cycles. The title below links to the text, which is well worth reading. Some excerpts follow in italics with my bolds. H/T GWPF
CMIP5 General Circulation Models versus a Semi-Empirical Model Based on Natural Oscillations
Updated 2019: Graph Comparing Scafetta Model with UAHv6
H/T Tallbloke for providing this image:

Green area is range of forecasts from CMIP5 models. Turquoise area is forecast from Scafetta astronomical climate model.
Scafetta comes out swinging: From the Abstract
Since 1850 the global surface temperature has warmed by about 0.9 oC. The CMIP5 computer climate models adopted by the IPCC have projected that the global surface temperature could rise by 2-5 oC from 2000 to 2100 for anthropogenic reasons. These projections are currently used to justify expensive mitigation policies to reduce the emission of anthropogenic greenhouse gases such as CO2.
However, recent scientific research has pointed out that the IPCC climate models fail to properly reconstruct the natural variability of the climate. Indeed, advanced techniques of analysis have revealed that the natural variability of the climate is made of several oscillations spanning from the decadal to the millennial scales (e.g. with periods of about 9.1, 10.4, 20, 60, 115, 1000 years and others). These oscillations likely have an astronomical origin.
In this short review I briefly summarize some of the main reasons why the AGWT should be questioned. In addition, I show that an alternative interpretation of climate change based on the evidences that a significant part of it is due to specific natural oscillations is possible. A modeling based on such interpretation agrees better with the climatic comprehensive picture deduced from the data.
The Missing Hot-Spot
It has been observed that for the last decades climate models predict a hot-spot, that is, a significant warming of a band of the upper troposphere 10 km over the tropics and the equator. The presence of this hot-spot is quite important because it would indicate that the water-vapor feedback to radiative forcing would be correctly reproduced by the models.
However, this predicted hot-spot has never been found in the tropospheric temperature records [20,21]. This could only be suggesting either that both the temperature records obtained with satellite measures and balloons have been poorly handled or that the models severely fail to properly simulate the water-vapor feedback. In the latter case, the flaw of the models would be fatal because the water-vapor feedback is the most important among the climate feedbacks.
Without a strong feedback response from water vapor the models would only predict a moderate climate sensitivity to radiative forcing of about 1.2 oC for CO2 doubling instead of about 3 oC. Figure 8 compares the observed temperature trend in the troposphere versus the climate model predictions: from Ref. [21]. The difference between the two record sets is evident.

Figure 8. Comparison between observed temperature trend in the troposphere (green-blue) versus the climate model predictions (red). From Ref. [21].
I have proposed that the global surface temperature record could be reconstructed from the decadal to the millennial scale using a minimum of 6 harmonics at 9.1, 10.4, 20, 60, 115 and 983 years plus a anthropogenic and volcano contribution that can be evaluated from the CMIP5 GCM outputs reduced by half because, as discussed above, the real climate sensitivity to radiative forcing appears to be about half of what assumed by the current climate models. The figure highlights the better performance of the solar–astronomical semi-empirical model versus the CMIP5 models. This is particularly evident since 2000, as shown in the inserts.

Figure 12 [A] The four CMIP5 ensemble average projections versus the HadCRUT4 GST record (black). [B] The solar– astronomical semi-empirical model. From Ref. [4] Left axis shows temperature anomalies in degrees Celsius.
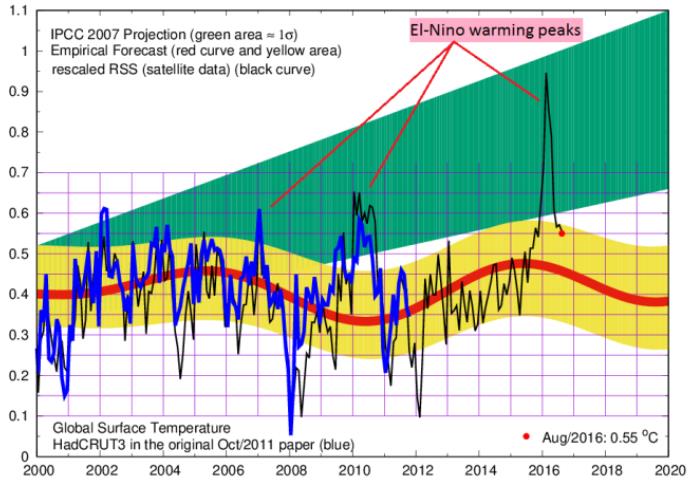
In 2011 I prepared a global surface temperature forecast based on a simplified climate model based on four natural oscillations (9.1, 10.4, 20 and 60 year) plus an estimate of a realistic anthropogenic contribution [25]: for example, see Refs. [33,34,35] referring to the 60-year cycle. Figure 13 compares my 2011 forecast (red curve) against the global surface temperature record I used in 2011 (HadCUT3, blue curve) and a modern global surface temperature record updated at June/2016 (RSS MSU record, black line, http://www.remss.com/measurements/upper-air-temperature).
The RSS MSU record, which is a global surface temperature estimate using satellite measurements, was linearly rescaled to fit the original HadCUT3 global surface temperature record for optimal comparison. Other global temperature reconstructions perform similarly. Note that the HadCUT3 has been dismissed in 2014. Figure 13 also shows in green a schematic representation of the IPCC GCMs prediction since 2000 [25].
Left axis shows temperature anomalies in degrees Celsius.
Figure 13. Comparison of the forecast (red-yellow curve) made in Scafetta (2011) [25] against (1) the temperature record used in 2011 (HadCRUT3, blue curve), (2) the IPCC climate model projections since 2000 (green area), (3) a recent global temperature record (RSS MSU record, black line, linearly re-scaled to match the HadCRUT3 from 1979 to 2014). The temperature record has followed Scafetta’s forecast better than the IPCC ones. In 2015-2016 there was a strong El-Nino Pacific Ocean natural warming that caused the observed temperature peak.
Summary
The considerations emerging from these findings yield to the conclusion that the IPCC climate models severely overestimate the anthropogenic climatic warming by about two times. I have finally proposed a semi-empirical climate model calibrated to reconstruct the natural climatic variability since Medieval times. I have shown that this model projects a very moderate warming until 2040 and a warming less than 2 oC from 2000 to 2100 using the same anthropogenic emission scenarios used by the CMIP5 models: see Figure 12.
This result suggests that climatic adaptation policies, which are less expensive than the mitigation ones, could be sufficient to address most of the consequences of a climatic change during the 21st century. Similarly, fossil fuels, which have contributed significantly to the development of our societies, can still be used to fulfill our energy necessities until equally efficient alternative energy sources could be determined and developed.
Scafetta Briefly Explains the Harmonic oscillation theory
“The theory is very simple in words. The solar system is characterized by a set of specific gravitational oscillations due to the fact that the planets are moving around the sun. Everything in the solar system tends to synchronize to these frequencies beginning with the sun itself. The oscillating sun then causes equivalent cycles in the climate system. Also the moon acts on the climate system with its own harmonics. In conclusion we have a climate system that is mostly made of a set of complex cycles that mirror astronomical cycles. Consequently it is possible to use these harmonics to both approximately hindcast and forecast the harmonic component of the climate, at least on a global scale. This theory is supported by strong empirical evidences using the available solar and climatic data.”
Update Nov. 20, 2017. Scafetta graph to June 2017

From Natural climate variability, part 2: Interpretation of the post 2000
temperature standstill, Scafetta et al. 2017
Footnote: Scafetta is not alone. Dr. Norman Page has a new paper going into detail about forecasting climate by means of solar-astronomical patterns.
The coming cooling: Usefully accurate climate forecasting for policy makers


Interesting article. I spent some time looking at Scafetta and responses. The major refutation points were (a) he is a skeptic, (b) his model didn’t hindcast and (c) just a few simple variables. I couldn’t find whether he could hindcast or not. I’ve noticed that the GCM models are trained by hindcasting and then fail to forecast. I prefer the forecast ability to hindcasting. It seems that by reducing GHG forcing he has been able to predict 6 years fairly well.
I’ve seen others suggest the climate forcing in the GCM’s is double what’s observed.
Your first link doesn’t work.
LikeLike
Thanks Bob. Link is now fixed. As for Scaffeta not hindcasting, his model is based on oscillations back to the middle ages. The graph in figure 12 above was produced in 2011, and shows his historical reconstruction back to 1860.
LikeLike