
The remarkable growth of Arctic ice extent continues with a new development yesterday, as shown by the graph below.

Note that as of day 330, Nov. 26, 2018, Arctic ice extent exceeds the 11 year average reached at month end. At 11.08M km2, it is 400k km2 above the average for day 330. It also matches 2013 (not shown) with only 2014 slightly higher in the last decade.

Dr. Judah Cohen at AER posted yesterday on the difficulties forecasting this winter’s coming months. Excerpts in italics with my bolds.
In my opinion troposphere-stratosphere coupling is now in full gear and is having a significant impact on the large-scale circulation of the atmosphere. The relatively active vertical transfer of energy from the troposphere to the stratosphere is repeatedly perturbing the stratospheric PV though it is not of sufficient magnitude to force a significant PV disruption but only minor disruptions. Still the stratospheric PV is predicted to be continuously displaced from the North Pole towards northwest Eurasia. The displacement of the stratospheric PV south of its normal position is allowing the stratospheric PV to grab milder temperatures from more southern latitudes and sling shot it from across Asia towards Eastern Siberia and Alaska, where the warming temperatures are building ridging/positive geopotential height anomalies in the stratosphere centered near Alaska. This is resulting in northerly flow between the Alaskan ridge and stratospheric PV on the North Atlantic side of the Arctic from central Siberia to eastern North America. We have seen the same flow already mimicked or repeated in the troposphere during the month of November contributing to an overall cold month of November in the Eastern US.
As far as the winter as a whole, I believe that the behavior of the stratospheric PV is critical. The vertical atmospheric energy transfer looks active to me for the foreseeable future. This could lead to a significant or major stratospheric PV as early as the second half of December and extending into early January. If a large stratospheric PV disruption were to occur in the late December and early January timeframe this would be almost ideal in contributing to an overall cold winter for the usual favored regions across the NH mid-latitudes, but each event is unique. Any delay in a significant stratospheric PV disruption would lead to an extended period of volatile weather and increase the odds for an overall mild winter especially if the stratospheric PV strengthens and becomes circular in shape. There is the scenario where the vertical energy transfer remains active, the stratospheric PV is perturbed but no significant disruptions occur and the Eastern US still experiences a cold winter ala winter 2013/14 and is described in our new paper: Kretschmer et al. 2018, but more on the paper in a future blog.
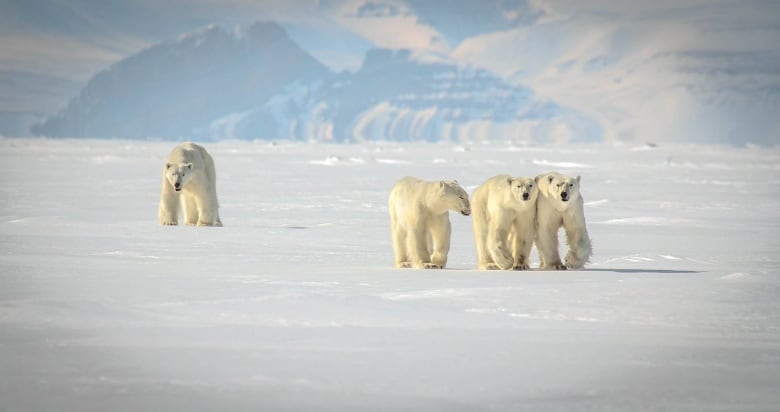
Meanwhile, in Nunavut, it is a great time to be a polar bear, even more of them than people want.

What is the source of the top graph please?
LikeLike
Mark, you may be interested to know that a commenter I deleted for his attitude was upset that I chose to look at a single month, November, and also that I am focused on the last 11 years. Now, everyone has seen the alarmist graphs which are confined to September, but no objections from the faithful. And it is the plateau in ice extents (lack of decline) since 2007 which is swept under the rug because it is inconvenient to the narrative on the grandstand at Katowice. All I am doing is pointing to the data that others are hiding or ignoring.
LikeLike
PS:
the reason I ask is because of what the just released U.S. Global Change Research Program 4th National Climate Assessment says (Report-in-Brief | Overview Excerpt (@ page 56)
Rapid Changes for Ice on Earth:
New observations from many different sources confirm that ice loss across the globe is continuing and, in many cases, accelerating. Since NCA3, Antarctica and Greenland have continued to lose ice mass, with mounting evidence that mass loss is accelerating.
LikeLike
Mark, I produced that graph from the MASIE dataset, accessible here:
https://nsidc.org/data/masie/
The Sea Ice Index data comes from here:
ftp://sidads.colorado.edu/DATASETS/NOAA/G02135/seaice_analysis/
LikeLike
As for the Greenland mass balance, the alarms are sounded out of context. My post on this is https://rclutz.wordpress.com/2015/10/29/greenland-is-melting-really/
The Antarctic ice mass is controversial, with gains in the eastern parts offsetting losses on the western peninsula (subject to underlying eruptions). See the paper by Zwally et al.
https://www.cambridge.org/core/journals/journal-of-glaciology/article/mass-gains-of-the-antarctic-ice-sheet-exceed-losses/983F196E23C3A6E7908E5FB32EB42268
LikeLike
Reblogged this on Climate Collections.
LikeLike