
Presently sea surface temperatures (SST) are the best available indicator of heat content gained or lost from earth’s climate system. Enthalpy is the thermodynamic term for total heat content in a system, and humidity differences in air parcels affect enthalpy. Measuring water temperature directly avoids distorted impressions from air measurements. In addition, ocean covers 71% of the planet surface and thus dominates surface temperature estimates. Eventually we will likely have reliable means of recording water temperatures at depth.
Recently, Dr. Ole Humlum reported from his research that air temperatures lag 2-3 months behind changes in SST. He also observed that changes in CO2 atmospheric concentrations lag behind SST by 11-12 months. This latter point is addressed in a previous post Who to Blame for Rising CO2?
The July update to HadSST3 will appear later this month, but in the meantime we can look at lower troposphere temperatures (TLT) from UAHv6 which are already posted for July. The temperature record is derived from microwave sounding units (MSU) on board satellites like the one pictured above.
The UAH dataset includes temperature results for air above the oceans, and thus should be most comparable to the SSTs. There is the additional feature that ocean air temps avoid Urban Heat Islands (UHI). The graph below shows monthly anomalies for ocean temps since January 2015.
 The anomalies are holding close to the same levels as 2015. In July, both the Tropics and SH rose, while NH rose very slightly, resulting in a small increase in the Global average of air over oceans. Taking a longer view, we can look at the record since 1995, that year being an ENSO neutral year and thus a reasonable starting point for considering the past two decades. On that basis we can see the plateau in ocean temps is persisting. Since last October all oceans have cooled, with offsetting bumps up and down.
| UAHv6 TLT Monthly Ocean Anomalies |
Average Since 1995 | Ocean 7/2018 |
| Global | 0.13 | 0.21 |
| NH | 0.16 | 0.3 |
| SH | 0.11 | 0.15 |
| Tropics | 0.13 | 0.29 |
As of July 2018, global ocean temps are slightly higher than June and the average since 1995. NH remains virtually the same, while both SH and Tropics rose making the global temp warmer. Global, NH and SH are matching July temps in 2015, while the Tropics are the lowest July since 2013.
The details of UAH ocean temps are provided below. The monthly data make for a noisy picture, but seasonal fluxes between January and July are important.
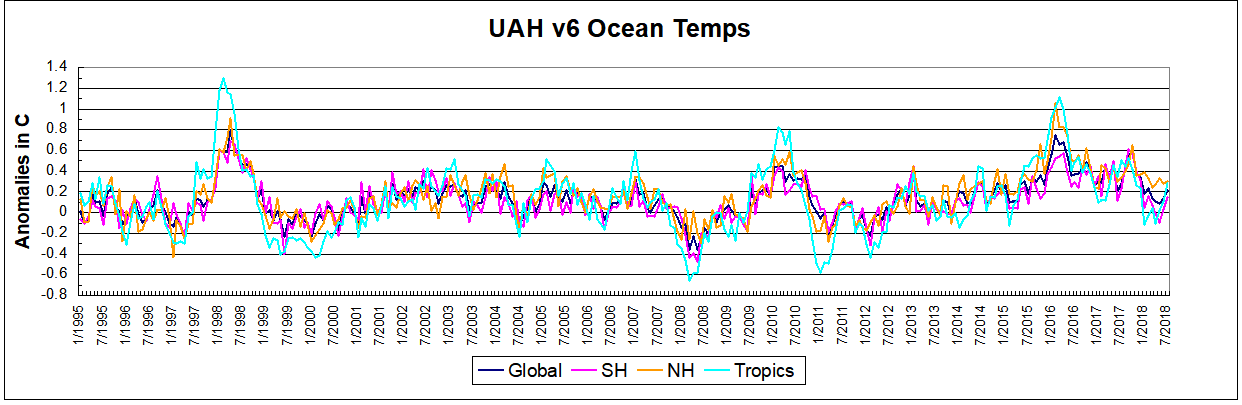
Open image in new tab to enlarge.
The greater volatility of the Tropics is evident, leading the oceans through three major El Nino events during this period. Note also the flat period between 7/1999 and 7/2009. The 2010 El Nino was erased by La Nina in 2011 and 2012. Then the record shows a fairly steady rise peaking in 2016, with strong support from warmer NH anomalies, before returning to the 22-year average.
Summary
TLTs include mixing above the oceans and probably some influence from nearby more volatile land temps. They started the recent cooling later than SSTs from HadSST3, but are now showing the same pattern. It seems obvious that despite the three El Ninos, their warming has not persisted, and without them it would probably have cooled since 1995. Of course, the future has not yet been written.

Reblogged this on Climate Collections.
LikeLike
So how do I convert from anomalies to degrees? In degrees the temperatures average out flat for the past century.
LikeLike
oil, don’t know how to answer. The baseline for UAH is monthly average for 1981 to 2010 inclusive. So the value for that range is zero, with fluctuations (anomalies) up and down. If you are asking what was the absolute temperature of the lower troposphere during 1981 to 2010, that is complicated From Wikipedia:
“The troposphere is heated from below by latent heat, longwave radiation, and sensible heat. Surplus heating and vertical expansion of the troposphere occurs in the tropics. At middle latitudes, tropospheric temperatures decrease from an average of 15 °C at sea level to about −55 °C at the tropopause. At the poles, tropospheric temperature only decreases from an average of 0 °C at sea level to about −45 °C at the tropopause. At the equator, tropospheric temperatures decrease from an average of 20 °C at sea level to about −70 to −75 °C at the tropopause. The troposphere is thinner at the poles and thicker at the equator. The average thickness of the tropical tropopause is roughly 7 kilometers greater than the average tropopause thickness at the poles.”
So the absolute value of any air parcel is subject to the lapse rate (estimated to be 6.5K/kilometer up to 11000 meters) and starting from a different surface temperature depending on latitude.
LikeLike