
New Zealand Cook National Park.
A dust up over the temperature trend in New Zealand is discussed at the the climate conversation New Zealand Response to NIWA comment on de Freitas reanalysis of the NZ temperature record by Barry Brill, Chairman of the New Zealand Climate Science Coalition. Excerpts with my bolds.
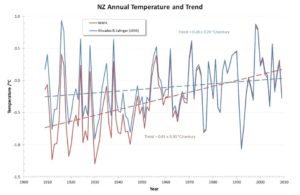
Conclusions
de Freitas finds that New Zealand has experienced an insignificant warming trend of 0.28°C/century during 1909-2008. Using the same data, the Mullan Report calculates that trend at 0.91°C/century. Both studies claim to apply the statistical technique described in RS93, and each alleges that the other has departed from that methodology. This core issue has been described in the graph above but has not been addressed in this note.
A second core issue relates to reliance upon inhomogeneous Auckland and Wellington data despite the extensive contamination of both sites by sheltering and UHI. That matter has not been addressed here either.
Instead, this limited reply deals with the raft of peripheral allegations contained in the NIWA Comment. In particular, it sets out to show that all plausible published records, as well as the scientific literature, support the view that New Zealand’s temperature record has remained remarkably stable over the past century or so.
Some of the Issues Rebutted
Other temperature records:
The de Freitas warming trend of 0.28°C/century is wholly consistent with the synchronous Southern Hemisphere trend reported in IPPC’s AR5. Both the IPCC and NIWA have long reported that anthropogenic warming trends in ocean-dominated New Zealand would be materially lower than global averages. The S81/Mullan Report trend of 0.91°C/century is clearly anomalous.
Official New Zealand temperature records for eight years in the 1860s, which are both reliable and area-representative, show the absolute mean temperature was then 13.1°C. A 30-year government record for the period ending 1919 shows the mean temperature to be 12.8°C. The current normal (30-year) mean 7SS temperature is 12.9°C. Clearly, New Zealand mean temperatures have remained almost perfectly stable during the past 150 years.
Use of RS93 Statistical Method:
The Mullan Report (along with other NIWA articles that are not publicly available) does purport to use RS93 comparison techniques, so this assertion is naturally accepted whenever these ‘grey’ papers are mentioned in the peer-reviewed literature. However, the Mullan Report sits outside the literature and clearly fails to execute its stated intention to apply RS93 methods. The de Freitas paper rectifies those omissions.
NZ Glaciers
In this area, the most recent authority is Mackintosh et al. (2017), entitled “Regional cooling caused recent New Zealand glacier advances in a period of global warming.” After observing that at least 58 Southern Alps glaciers advanced during the period 1983-2008, the abstract notes:
“Here we show that the glacier advance phase resulted predominantly from discrete periods of reduced air temperature, rather than increased precipitation. The lower temperatures were associated with anomalous southerly winds and low sea surface temperature in the Tasman Sea region. These conditions result from variability in the structure of the extratropical atmospheric circulation over the South Pacific.”
This Nature paper, of which James Renwick was an author, notes that the World Glacier Monitoring Service database shows that in 2005 “15 of the 26 advancing glaciers observed worldwide were in New Zealand.”
BEST Data
Using up to 52 auto-adjusted datasets1, the Berkeley Earth group derives an absolute New Zealand temperature range of 9.5°C to 11°C over the 160-year period from 1853 to 2013.
The mid-point of this range is very far from the mid-point of the 12.3°C to 13.2°C range recorded in the 7SS (whether raw or adjusted) and is clearly wrong. Nonetheless, for the 100-year period 1909-2008, the BEST adjusted anomalies are said to show a 100% perfect correlation with those of the Mullan Report (to three decimal points). The claimed independence of such an immaculate outcome is entirely implausible.
Anthropogenic Warming
The Mullan Report’s 1960-90 upwards spike could not have occurred whilst the south-west Pacific region was in a cooling phase – which is confirmed by Mackintosh et al. (2017). Further, the final 30-year period of the Mullan Report shows an insignificant trend of only 0.12°C/century, demonstrating that New Zealand has not yet been affected by global warming trends.
Summary
Good to see that de Fritas et al are again speaking climate truth to entrenched alarmists. Go Kiwis!

Thanks very much! Most encouraging.
LikeLike
The homogenised and adjusted data are difficult to understand in terms of the past always being cooled, while theUHI increase would make it more logical to reduce current temperatures. I have never seen a publication that explains the adjustments simply: do you know of one?
LikeLike
Jack, I don’t know of a thorough description of the UHI adjustment procedure. The usual explanation is the intent to make past measurement comparable to present day, the assumption being current instruments are the highest quality.
Yet as my own (and others’ analyses) have shown, current records are also dropped in favor of infilling by means of algorithms. The secret sauce remains unexplained.
LikeLike
A further thought, several statisticians have commented: Even without knowing the procedures, any adjustment process that results in always adding a warming trend must be in error. Normally, corrections to measurements would be somewhat balanced up and down. In temperature records, the adjusted distant past is always cooler and the recent past warmer.
LikeLike
Thanks Ron, I am suspicious of the homogenisation and the fact that there is no simple formula for this.
It appears counter-intuitive that the sites of measurements are nearer UHIs than in past times, yet. The new data are regarded as accurate while older truly-rural measurements are somehow too high. The UHI effect is of order 2 deg K as can be seen in any weather report: so recent measurements would be positively biased relative to older data, so should surely be reduced, or the past warmed in comparisons
LikeLike