 The month of March saw rapid ice growth in Barents Sea. It is in a strategic location at the gateway where warm Atlantic water from the gulf stream flows into the Arctic, 90% of all incoming water. In 31 days, the extent went from 513k km2 to 790k km2, a gain of 278k km2, or 54%. As the graph below shows, Barents ice today is unusual in the last 12 years.

March is the time of the annual Arctic ice maximum, as the graph below shows. 2018 started slow and peaked later than average, and has held on to March end.
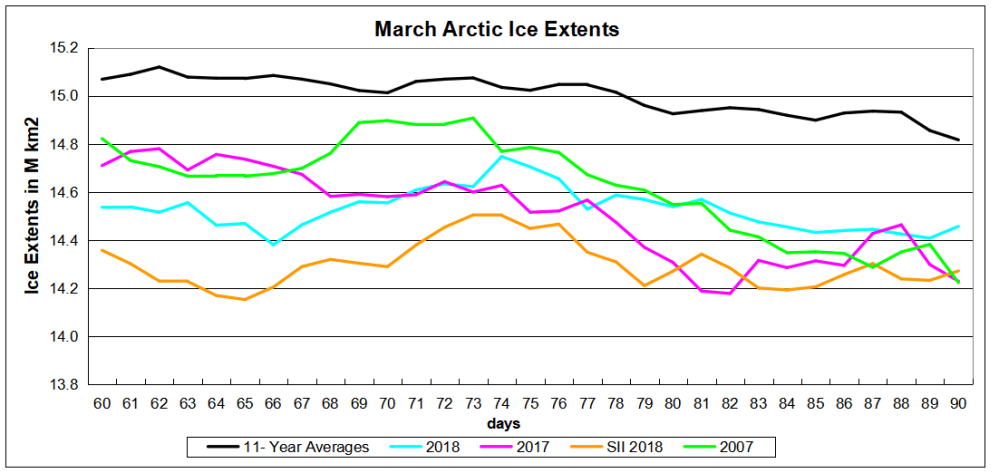
2018 is running about 200k km2 above both 2017 and 2007. SII shows ~200k km2 less than MASIE. The ten year average extent is almost 400k km2 higher, entirely due to 2018 lack of ice in Bering Sea. The table below shows ice extents in the various basins at day 90 or March 31.
| Region | 2018090 | Day 90 Average |
2018-Ave. | 2017090 | 2018-2017 |
| (0) Northern_Hemisphere | 14456459 | 14842431 | -385972 | 14228992 | 227467 |
| (1) Beaufort_Sea | 1069836 | 1070178 | -342 | 1070445 | -609 |
| (2) Chukchi_Sea | 964121 | 966000 | -1879 | 966006 | -1885 |
| (3) East_Siberian_Sea | 1087137 | 1085933 | 1204 | 1086168 | 969 |
| (4) Laptev_Sea | 897845 | 896562 | 1283 | 897845 | 0 |
| (5) Kara_Sea | 934790 | 915735 | 19055 | 831189 | 103601 |
| (6) Barents_Sea | 790204 | 652874 | 137329 | 525362 | 264841 |
| (7) Greenland_Sea | 533694 | 669996 | -136302 | 705581 | -171886 |
| (8) Baffin_Bay_Gulf_of_St._Lawrence | 1380945 | 1452576 | -71631 | 1467334 | -86390 |
| (9) Canadian_Archipelago | 853109 | 852782 | 327 | 853214 | -106 |
| (10) Hudson_Bay | 1259857 | 1252696 | 7161 | 1260903 | -1047 |
| (11) Central_Arctic | 3202650 | 3236293 | -33643 | 3247995 | -45345 |
| (12) Bering_Sea | 277469 | 849159 | -571690 | 702504 | -425035 |
| (13) Baltic_Sea | 99317 | 68831 | 30486 | 29767 | 69550 |
| (14) Sea_of_Okhotsk | 1097524 | 860025 | 237498 | 575084 | 522440 |

Reblogged this on Climate Collections.
LikeLiked by 1 person
Still hoping for a last surge, if so must be in next 3 days.
LikeLike