
Click on image to enlarge.
Coinciding with the Siberian air freezing Niagara Falls and extending frigid temperatures as far south as Carolina, Arctic ice extent got quite variable in the North Pacific, especially in Okhotsk on the left. The image above shows how ice in that basin shuffled forward, backward and forward again.
Mid-December Okhotsk Sea on the left began growing ice steadily to reach half of 2017 March max, then inexplicably lost over 300k km2 of ice in just four days. In the last nine days it more than gained back the loss. Meanwhile, Chukchi (upper right) was frozen completely, then retreated, and now closed again. Bering Sea on the right has been advancing steadily but more slowly than average.
Ice extents for January appear in the graph below; 2018 is shown to date, other years for the full month. 11 year average is 2007 to 2017 inclusive.
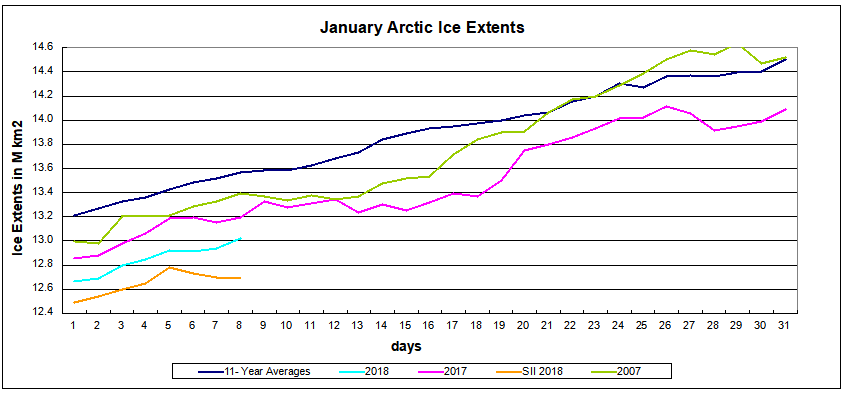
Note that 2007 catches and exceeds the 11 year average ending the month tied. 2017 and 2018 are adding ice at nearly average rate but started with deficits to average. SII 2018 has fallen further behind.
Below is the analysis of regions on day 008. Average is for 2007 to 2017 inclusive.
| Region | 2018008 | Day 008 Average |
2017-Ave. | 2017008 | 2018-2017 |
| (0) Northern_Hemisphere | 13019244 | 13560397 | -541153 | 13194225 | -174981 |
| (1) Beaufort_Sea | 1070445 | 1070178 | 267 | 1070445 | 0 |
| (2) Chukchi_Sea | 965971 | 966005 | -34 | 966006 | -35 |
| (3) East_Siberian_Sea | 1087120 | 1087136 | -16 | 1087137 | -18 |
| (4) Laptev_Sea | 897845 | 897842 | 3 | 897845 | 0 |
| (5) Kara_Sea | 888549 | 920916 | -32367 | 917704 | -29156 |
| (6) Barents_Sea | 343580 | 486463 | -142883 | 306884 | 36696 |
| (7) Greenland_Sea | 551915 | 599604 | -47690 | 518372 | 33543 |
| (8) Baffin_Bay_Gulf_of_St._Lawrence | 1044045 | 1063947 | -19902 | 1199200 | -155154 |
| (9) Canadian_Archipelago | 853109 | 853040 | 69 | 853214 | -106 |
| (10) Hudson_Bay | 1260838 | 1241598 | 19240 | 1260887 | -49 |
| (11) Central_Arctic | 3202818 | 3207336 | -4518 | 3125131 | 77687 |
| (12) Bering_Sea | 212150 | 544302 | -332152 | 165702 | 46449 |
| (13) Baltic_Sea | 18026 | 42662 | -24636 | 22885 | -4859 |
| (14) Sea_of_Okhotsk | 593649 | 537888 | 55760 | 783663 | -190014 |
Note that 2018 deficit to average comes mostly from Bering and Barents Seas. The recovering ice in Okhotsk is now above average but still below last year, when Okhotsk accounts for the difference.

Background: Updated Winter Forecast by Dr. Judah Cohen, January 8, 2018
Dr. Judah Cohen of AER published his current Arctic Oscillation and Polar Vortex Analysis and Forecast on January 8, 2018. His comments are always enlightening, and particularly so this time. Excerpts in italics with my bolds.
A minor but regionally very impactful stratospheric PV disruption promoted persistent cross polar flow that emptied Siberia of its cold air and carried it on a direct route to Southeastern Canada and the Northeastern US over the past two weeks. The historic cold of the past two weeks has placed the Eastern US in a position to finish with a cold winter but in no way, has guaranteed the outcome. I am of the opinion that for the winter in the Eastern US to finish with an overall cold solution then at least one other stratospheric PV is necessary but still may not be sufficient. Given the magnitude of the most recent cold air outbreak either a minor or major PV disruption could be enough to ensure a cold winter in aggregate over the three months from December through February.
I would argue that whether the winter will finish in the warm or cold column is science vs. art (at least my own artistic rendition). The science says that the second half of winter will be warm across the Eastern US including the remainder of January and all of February. All dynamical forecasts including most climate forecast system (CFS) forecasts, the national multi-model ensemble (NMME) and the European models all forecast warm see Figure i).
My own instinct tells me the winter will end in the cold column. Of course, the AER winter forecast predicts a cold winter based on Siberian snow cover, Arctic sea ice and tropospheric precursors. But my instinct or gut feeling is based on different metrics – the period of cold, northeastern snowfall and temperature records.
There have been some famously cold Decembers followed by a relatively mild remainder of winter. The two that most readily come to my mind are winters 1983/84 and 1989/90. One more recent but not as dramatic was winter 2005/06. And if my recollection is correct, those cold Decembers transitioned from cold to mild around the holiday season. I cannot recall a mild winter when the cold from December extended into January.
The second is significant snowfall in the I95 corridor. Again, I can’t recall a snowstorm this early in the season of the magnitude of this week’s blizzard occurring during mild winters. I certainly can’t recall any in 1983/84, 1989/90 or 2005/06, though in that last winter there was significant snowfall in February.
Finally, are record temperatures mostly in January. It seems to me that record cold or warm temperatures are an early indication of the overall winter anomaly. Record warm temperatures occur in an overall warm winters and record cold temperatures in an overall cold winter and less so vice versa. I do believe fairly strongly that Nature likes to foreshadow and those are some of the foreshadowing markers that I follow.
Interestingly below normal or convergence of vertical Wave Activity Flux (WAFz) is predicted in the troposphere for next week. This actually favors increased high latitude blocking and may explain the return of strong Alaska ridging with downstream eastern North America troughing and cold weather. But rather than a committed turn to the cold path this appears to be more of a head fake and more mild weather is predicted for the third week of January. Therefore, the return to mild weather in the Eastern US makes me believe we still remain situated at the fork in the road without a full commitment to either the mild or warm path. Though if the GFS forecast of cold reloading in Canada is correct, I think that it is almost inevitable for that cold to slide down into the lower 48 with time.

Put in other words the fork can be represented by the divergence in the polar cap geopotential heights (PCHs) between the troposphere and the stratosphere. PCHs are overall warm/positive in the troposphere while PCHs are overall cold/negative in the stratosphere. In probably overly simplistic terms I am waiting for convergence of either warm or cold PCHs throughout the troposphere and the stratosphere before claiming winter has fully committed to a cold (universal warm PCHs) or mild (universal cold PCHs) winter.
Whichever fork the ice takes, the Polar Bears had a very happy New Years Day.

