
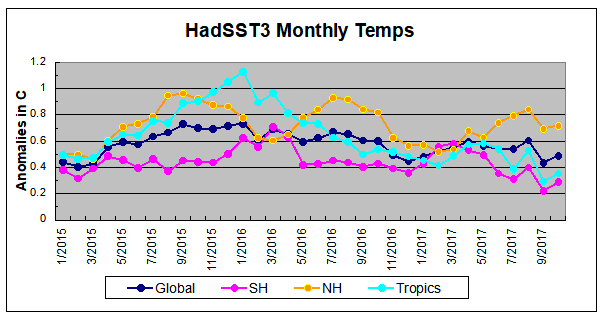
October Sea Surface Temperatures (SSTs) are now available, and we see a slight upward response after a steep drop in September. The rise was led by anomaly increases of about 0.06 in both the Tropics and SH, compared to drops of about 0.2 the previous month. NH was virtually the same as September. Global average anomaly changed as much as the Tropics and SH, but remains lower than the three previous Octobers.
HadSST is generally regarded as the best of the global SST data sets, and so the temperature story here comes from that source, the latest version being HadSST3.
The chart below shows SST monthly anomalies as reported in HadSST3 starting in 2015 through October 2017.
A longer view of SSTs
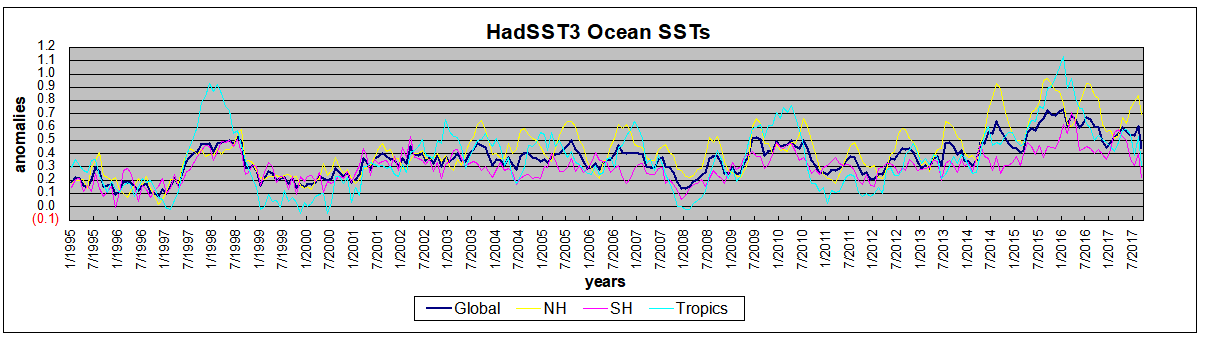
The graph below is noisy, but the density is needed to see the seasonal patterns in the oceanic fluctuations. Previous posts focused on the rise and fall of the last El Nino starting in 2015. This post adds a longer view, encompassing the significant 1998 El Nino and since. The color schemes are retained for Global, Tropics, NH and SH anomalies. Despite the longer time frame, I have kept the monthly data (rather than yearly averages) because of interesting shifts between January and July.
Click on image to enlarge.
1995 is a reasonable starting point prior to the first El Nino. The sharp Tropical rise peaking in 1998 is dominant in the record, starting Jan. ’97 to pull up SSTs uniformly before returning to the same level Jan. ’99. For the next 2 years, the Tropics stayed down, and the world’s oceans held steady around 0.2C above 1961 to 1990 average.
Then comes a steady rise over two years to a lesser peak Jan.2003, but again uniformly pulling all oceans up around 0.4C. Something changes at this point, with more hemispheric divergence than before. Over the 4 years until Jan 2007, the Tropics go through ups and downs, NH a series of ups and SH mostly downs. As a result the Global average fluctuates around that same 0.4C, which also turns out to be the average for the entire record since 1995.
2007 stands out with a sharp drop in temperatures so that Jan.08 matches the low in Jan. ’99, but starting from a lower high. The oceans all decline as well, until temps build peaking in 2010.
Now again a different pattern appears. The Tropics cool sharply to Jan 11, then rise steadily for 4 years to Jan 15, at which point the most recent major El Nino takes off. But this time in contrast to ’97-’99, the Northern Hemisphere produces peaks every summer pulling up the Global average. In fact, these NH peaks appear every July starting in 2003, growing stronger to produce 3 massive highs in 2014, 15 and 16, with July 2017 only slightly lower. Note also that starting in 2014 SH plays a moderating role, offsetting the NH warming pulses. (Note: these are high anomalies on top of the highest absolute temps in the NH.)
What to make of all this? The patterns suggest that in addition to El Ninos in the Pacific driving the Tropic SSTs, something else is going on in the NH. IMO the culprit is the North Atlantic, since I have seen this sort of pulsing before. After reading some papers by David Dilley, I confirmed his observation of Atlantic pulses into the Arctic every 8 to 10 years as shown by this graph:
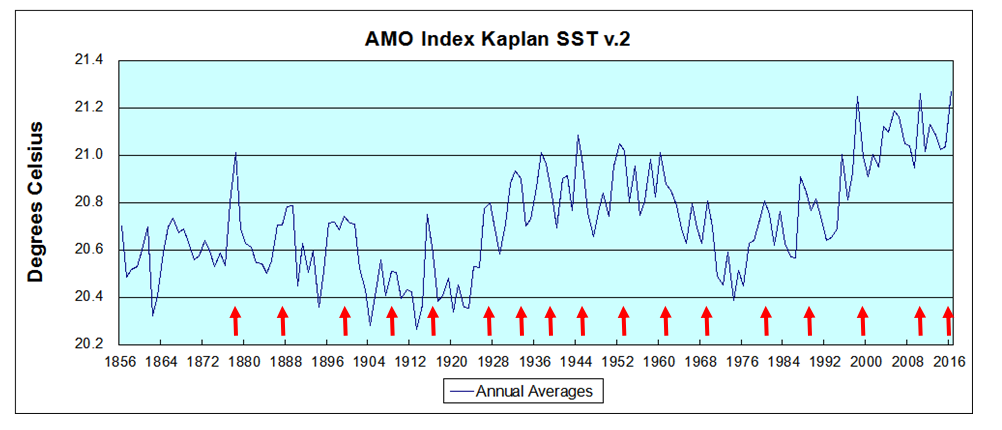 The data is annual averages of absolute SSTs measured in the North Atlantic. The significance of the pulses for weather forecasting is discussed in AMO: Atlantic Climate Pulse
But the peaks coming nearly every July in HadSST require a different picture. Let’s look at August, the hottest month in the North Atlantic from the Kaplan dataset. Now the regime shift appears clearly. Starting with 2003, seven times the August average has exceeded 23.6C, a level that prior to ’98 registered only once before, in 1937. And other recent years were all greater than 23.4C.
Summary
The oceans are driving the warming this century. SSTs took a step up with the 1998 El Nino and have stayed there with help from the North Atlantic, and more recently the Pacific northern “Blob.” The ocean surfaces are releasing a lot of energy, warming the air, but eventually will have a cooling effect. The decline after 1937 was rapid by comparison, so one wonders: How long can the oceans keep this up?

USS Pearl Harbor deploys Global Drifter Buoys in Pacific Ocean

Reblogged this on WeatherAction News and commented:
The longer term look on the oceans is well worth a read
LikeLike
Very interesting analyses and your ideas make good sense. We live in a water world and water in all three phases seems to be the dominant player in climate changes over decades and centuries. I also suspect the oceans play a very important role in Arctic ice and air temperature anomalies, including effects of the Atlantic oscillations into the Arctic Sea. Too bad we don’t have our modern day measurements going back thousands of years to help clarify what has been happening. And wouldn’t it be great if coupled land/ocean/air models could predict these changes?
It will be interesting to see how strong the incipient La Nina pattern develops over this winter and its potential effects on global surface air temperatures next year. Yet another example of an ocean/atmosphere phenomenon that has not been successfully modeled.
LikeLike
Thanks oz. On your point about the Arctic, I am persuaded by AARI researchers seeing it as a self-oscillating system involving water, wind and weather.

See https://rclutz.wordpress.com/2015/12/23/arctic-sea-ice-self-oscillating-system/
LikeLike
Thanks for the reminder link. I now remember seeing this post in the past but had forgotten about. Looks like we are in agreement on this one.
LikeLike