We are about 4 days away from the annual Arctic ice extent minimum, which typically occurs on or about day 260 (mid September). Some take any year’s slightly lower minimum as proof that Arctic ice is dying, but the image below shows day 260 over the last 10 years. The Arctic heart is beating clear and strong.

Click on image to enlarge.
Recent posts noted that 2017 Arctic ice extents were stabilizing and then coasting to a halt. Now we are seeing a reversal with ice growing in all but one region. While the daily average extent over the last 10 years bottomed out on day 260, years like 2016 and 2009 hit minimum on day 254. This year’s extent was at 4.7M km2 for a week, hit bottom at 4.6M on day 253, and 3 days later is now up to 4.8M km2. SII (Sea Ice Index) 2017 is similar to MASIE, though a bit lower lately. The graph below shows September comparisons.
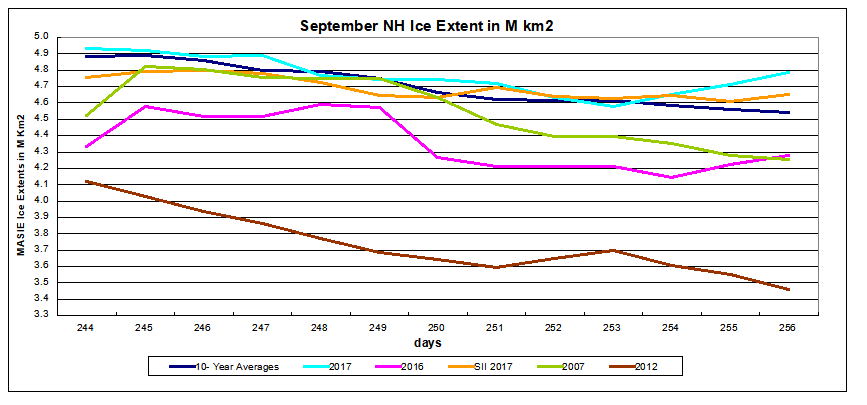 Note that as of day 256, 2017 has gone 250k km2 above average, 500k km2 above 2007 and 2016, and 1300k km2 greater than 2012. All regions are adding ice, with Central Arctic the only exception. That is likely due to Central Arctic sea already full of ice at 3.1M km2. The image below shows impressive refreezing in the Canadian Archipelago.
Click on image to enlarge.
Over this decade, the Arctic ice minimum has not declined, but looks like fluctuations around a plateau since 2007. By mid-September, all the peripheral seas have turned to water, and the residual ice shows up in a few places. The table below indicates where we can expect to find ice this September. (Shows day 260 amounts with 10 year averages)
| Arctic Regions | 2007 | 2010 | 2012 | 2014 | 2015 | 2016 | Average |
| Central Arctic Sea | 2.67 | 3.16 | 2.64 | 2.98 | 2.93 | 2.92 | 2.91 |
| BCE | 0.50 | 1.08 | 0.31 | 1.38 | 0.89 | 0.52 | 0.87 |
| LKB | 0.29 | 0.24 | 0.02 | 0.19 | 0.05 | 0.28 | 0.17 |
| Greenland & CAA | 0.56 | 0.41 | 0.41 | 0.55 | 0.46 | 0.45 | 0.46 |
| B&H Bays | 0.03 | 0.03 | 0.02 | 0.02 | 0.10 | 0.03 | 0.03 |
| NH Total | 4.05 | 4.91 | 3.40 | 5.13 | 4.44 | 4.20 | 4.45 |
BCE (Beaufort, Chukchi and East Siberian) on the Asian side are quite variable as the largest source of ice other than the Central Arctic itself. Greenland Sea and CAA (Canadian Arctic Archipelago) together hold almost 0.5M km2 of ice at minimum, fairly consistently. LKB are the European seas of Laptev, Kara and Barents, a smaller source of ice, but a difference maker some years, as Laptev was in 2016. Baffin and Hudson Bays are almost inconsequential.

For context, note that the average maximum has been 15M, so on average the extent shrinks to 30% of the March high before growing back the following winter.
Footnote
Some people unhappy with the higher amounts of ice extent shown by MASIE continue to claim that Sea Ice Index is the only dataset that can be used. This is false in fact and in logic. Why should anyone accept that the highest quality picture of ice day to day has no shelf life, that one year’s charts can not be compared with another year? Researchers do this, including Walt Meier in charge of Sea Ice Index. That said, I understand his interest in directing people to use his product rather than one he does not control. As I have said before:
MASIE is rigorous, reliable, serves as calibration for satellite products, and continues the long and honorable tradition of naval ice charting using modern technologies. More on this at my post Support MASIE Arctic Ice Dataset


Sailing along the coast of NW Europe towards the Baltic back in June, I met an intrepid Dutch sailor who had sailed in the Arctic these past few summers and who was looking forward to going even further north this time, because, “you know, the Arctic is definitely going to be ice free this summer”. I told him without hesitation that it certainly wasn’t going to be ice free this year and that in fact there was likely to be rather more ice this year than last. I’m now hoping to meet him again on our way back down south and be able to say with confidence “I told you so!”
LikeLike
Thanks for that story Sara. It shows how a narrative like “Arctic ice death spiral” takes hold and then never questioned, even when the facts don’t go along.
LikeLike
It’s following well written, researched and readable scientific sites like yours, Ron that has given me the confidence to stand up to the many alarmists that I encounter, mostly younger people it would appear. We spent 7 weeks this summer sailing with a lovely couple aged 37 &40 years, highly intelligent and well educated but also thoroughly indoctrinated with regard to “climate change” being both avid BBC followers and Guardian readers. Eek!
Having a captive audience on the boat (it’s amazing how you just have be listened to at 3am while at sea and on watch!), we didn’t let up on them for a minute and they could see for themselves the hundreds and hundreds of (mostly non functioning) offshore wind turbines that we so often had to navigate around in the Baltic and along the NW European coasts of Germany & Holland.
LikeLike
“Men, it has been well said, think in herds; it will be seen that they go mad in herds, while they only recover their senses slowly, and one by one.” Charles Mackay
LikeLiked by 1 person
Reblogged this on Climate Collections.
LikeLike
Your thoughts on causes of the rapid slowdown in loss and hopefully quick rebuild this year.
The high amount of land snow was one. The high Greenland ice accumulation while mainly a symptom rather than a cause would have helped in turn as positive feedback.
Colder currents in the Barents etc. Wind circulation pushing ice back into the Fram ( made that up).
Or just a delayed response to the end of the El Niño.
If this is the turning point it does not promise a rapid rebuild but I hope we get a couple in a row again soon.
LikeLike
angech, I remain convinced of the 3 Ws concerning Arctic ice. Water in this case refers to the influx of colder than usual North Atlantic water (the cold blob that may be finally having an impact). We have to watch Barents in coming weeks to how refreezing takes hold there. Wind and Weather are notable this year by the absence of destructive Arctic storms and circulations, and as you say, bringing early snowfall moderating the melting.
For future years, who knows? It is enough for now that the plateau since 2007 continues.
LikeLike
I could be wrong, but the deeper the water the more stable the ice is at the surface. As in a swimming pool it’s colder down the deep end.
LikeLike
Remember that ice grows because of a transfer of heat from the relatively warm ocean to the cold air above. Also remember that ice insulates the ocean from the atmosphere and inhibits this heat transfer. The amount of insulation depends on the thickness of the ice; thicker ice allows less heat transfer. If the ice becomes thick enough that no heat from the ocean can be conducted through the ice, then ice stops growing. This is called the thermodynamic equilibrium thickness. It may take several years of growth and melt for ice to reach the equilibrium thickness. In the Arctic, the thermodynamic equilibrium thickness of sea ice is approximately 3 meters (9 feet). However, dynamics can yield sea ice thicknesses of 10 meters (30 feet) or more. Equilibrium thickness of sea ice is much lower in Antarctica, typically ranging from 1 to 2 meters (3 to 6 feet).
https://rclutz.wordpress.com/2015/05/26/climate-on-ice-ocean-ice-dynamics/
LikeLike
Reblogged this on WeatherAction News and commented:
A journalist has asked the Arctic about reports of its demise;
“I can understand perfectly how the report of my illness got about, I have even heard on good authority that I was dead…The report of my death was an exaggeration”
😉
LikeLike