UAH March 2024: Oceans Start Cooling, Land Warmer

The post below updates the UAH record of air temperatures over land and ocean. Each month and year exposes again the growing disconnect between the real world and the Zero Carbon zealots.  It is as though the anti-hydrocarbon band wagon hopes to drown out the data contradicting their justification for the Great Energy Transition.  Yes, there has been warming from an El Nino buildup coincidental with North Atlantic warming, but no basis to blame it on CO2.  

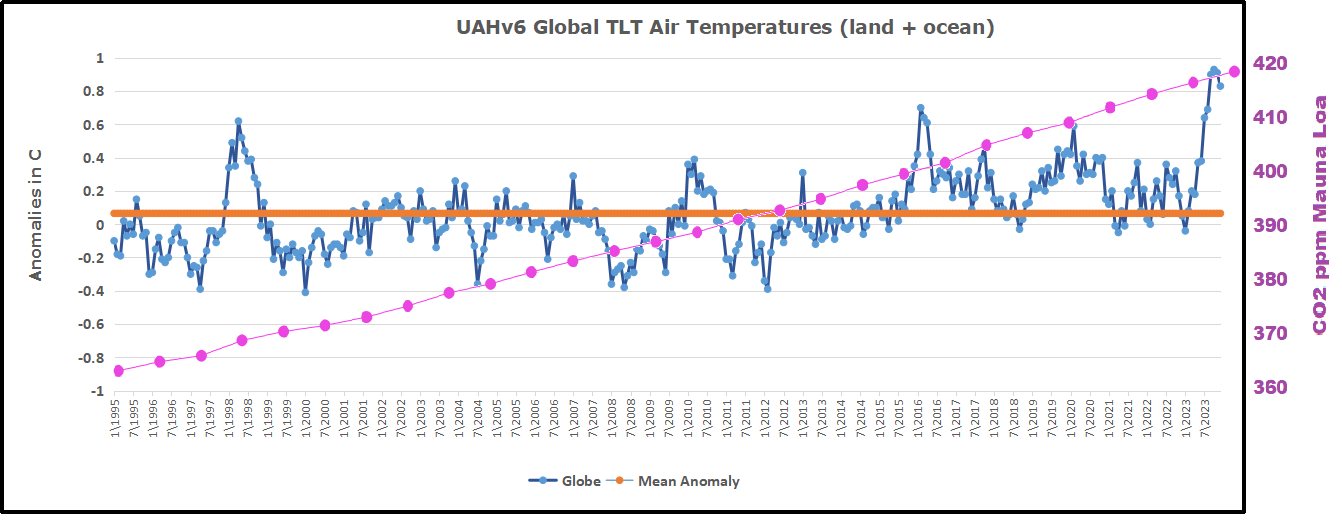
As an overview consider how recent rapid cooling  completely overcame the warming from the last 3 El Ninos (1998, 2010 and 2016).  The UAH record shows that the effects of the last one were gone as of April 2021, again in November 2021, and in February and June 2022  At year end 2022 and continuing into 2023 global temp anomaly matched or went lower than average since 1995, an ENSO neutral year. (UAH baseline is now 1991-2020). Now we have an usual El Nino warming spike of uncertain cause, but unrelated to steadily rising CO2.

For reference I added an overlay of CO2 annual concentrations as measured at Mauna Loa.  While temperatures fluctuated up and down ending flat, CO2 went up steadily by ~60 ppm, a 15% increase.

Furthermore, going back to previous warmings prior to the satellite record shows that the entire rise of 0.8C since 1947 is due to oceanic, not human activity.
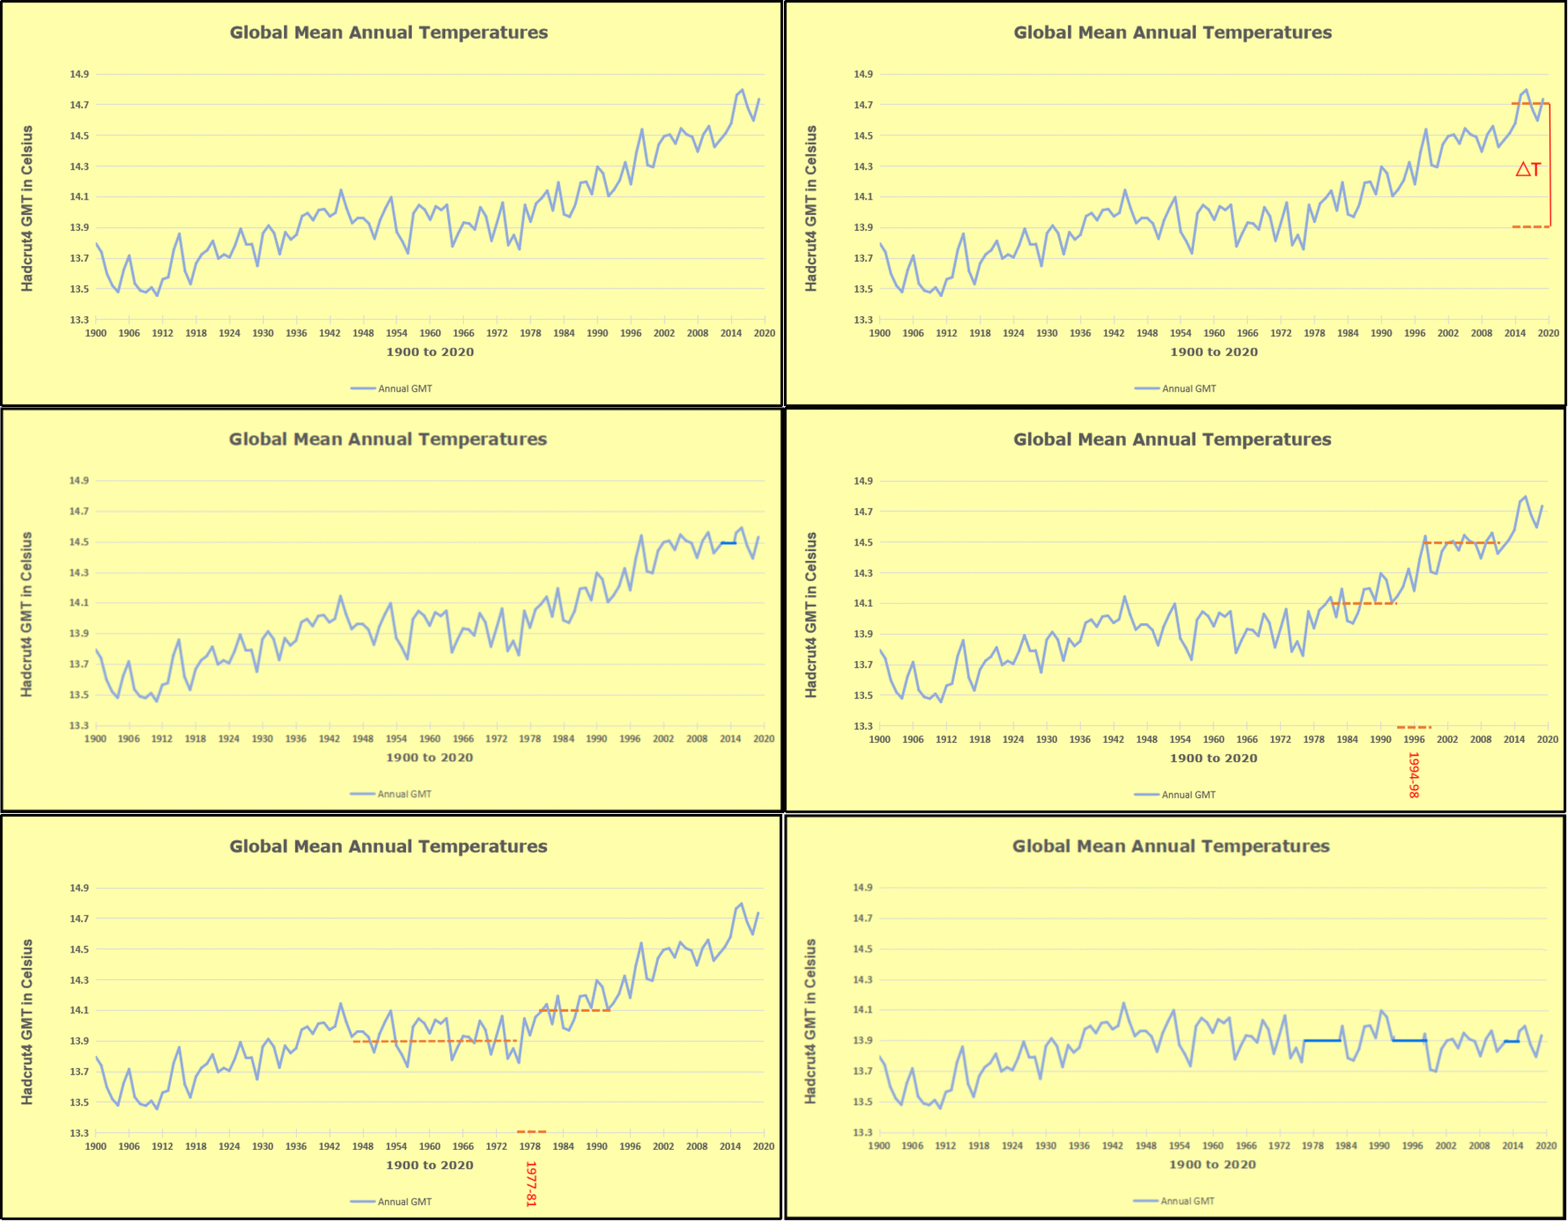
gmt-warming-events

The animation is an update of a previous analysis from Dr. Murry Salby.  These graphs use Hadcrut4 and include the 2016 El Nino warming event.  The exhibit shows since 1947 GMT warmed by 0.8 C, from 13.9 to 14.7, as estimated by Hadcrut4.  This resulted from three natural warming events involving ocean cycles. The most recent rise 2013-16 lifted temperatures by 0.2C.  Previously the 1997-98 El Nino produced a plateau increase of 0.4C.  Before that, a rise from 1977-81 added 0.2C to start the warming since 1947.

Importantly, the theory of human-caused global warming asserts that increasing CO2 in the atmosphere changes the baseline and causes systemic warming in our climate.  On the contrary, all of the warming since 1947 was episodic, coming from three brief events associated with oceanic cycles. And now in 2023 we are seeing an amazing episode with a temperature spike driven by ocean air warming in all regions, with some cooling the last two months. 

Update August 3, 2021

Chris Schoeneveld has produced a similar graph to the animation above, with a temperature series combining HadCRUT4 and UAH6. H/T WUWT

image-8


mc_wh_gas_web20210423124932

See Also Worst Threat: Greenhouse Gas or Quiet Sun?

March 2024 El Nino Persists While Oceans Cool, Land Warmsbanner-blog

With apologies to Paul Revere, this post is on the lookout for cooler weather with an eye on both the Land and the Sea.  While you heard a lot about 2020-21 temperatures matching 2016 as the highest ever, that spin ignores how fast the cooling set in.  The UAH data analyzed below shows that warming from the last El Nino had fully dissipated with chilly temperatures in all regions. After a warming blip in 2022, land and ocean temps dropped again with 2023 starting below the mean since 1995.  Spring and Summer 2023 saw a series of warmings, continuing into October, but with cooling since. 

UAH has updated their tlt (temperatures in lower troposphere) dataset for March 2024. Posts on their reading of ocean air temps this month precedes updates from HadSST4.  I posted last month on SSTs using HadSST4 Ocean Cools as El Nino Recedes February 2024. This month also has a separate graph of land air temps because the comparisons and contrasts are interesting as we contemplate possible cooling in coming months and years.

Sometimes air temps over land diverge from ocean air changes.  November 2023 was notable for a dichotomy between Ocean and Land air temperatures in UAH dataset. Remarkably a new high for Ocean air temps appeared with warming in all regions, while Land air temps dropped with cooling in all regions.  As a result the Global Ocean and Land anomaly result remained little changed. Last month in February 2024, both ocean and land air temps went higher driven by SH, while NH and the Tropics cooled slightly, resulting in Global anomaly matching October 2023 peak. Now in March Ocean anomalies cooled while Land anomalies rose everywhere.

Note:  UAH has shifted their baseline from 1981-2010 to 1991-2020 beginning with January 2021.  In the charts below, the trends and fluctuations remain the same but the anomaly values changed with the baseline reference shift.

Presently sea surface temperatures (SST) are the best available indicator of heat content gained or lost from earth’s climate system.  Enthalpy is the thermodynamic term for total heat content in a system, and humidity differences in air parcels affect enthalpy.  Measuring water temperature directly avoids distorted impressions from air measurements.  In addition, ocean covers 71% of the planet surface and thus dominates surface temperature estimates.  Eventually we will likely have reliable means of recording water temperatures at depth.

Recently, Dr. Ole Humlum reported from his research that air temperatures lag 2-3 months behind changes in SST.  Thus cooling oceans portend cooling land air temperatures to follow.  He also observed that changes in CO2 atmospheric concentrations lag behind SST by 11-12 months.  This latter point is addressed in a previous post Who to Blame for Rising CO2?

After a change in priorities, updates are now exclusive to HadSST4.  For comparison we can also look at lower troposphere temperatures (TLT) from UAHv6 which are now posted for March.  The temperature record is derived from microwave sounding units (MSU) on board satellites like the one pictured above. Recently there was a change in UAH processing of satellite drift corrections, including dropping one platform which can no longer be corrected. The graphs below are taken from the revised and current dataset.

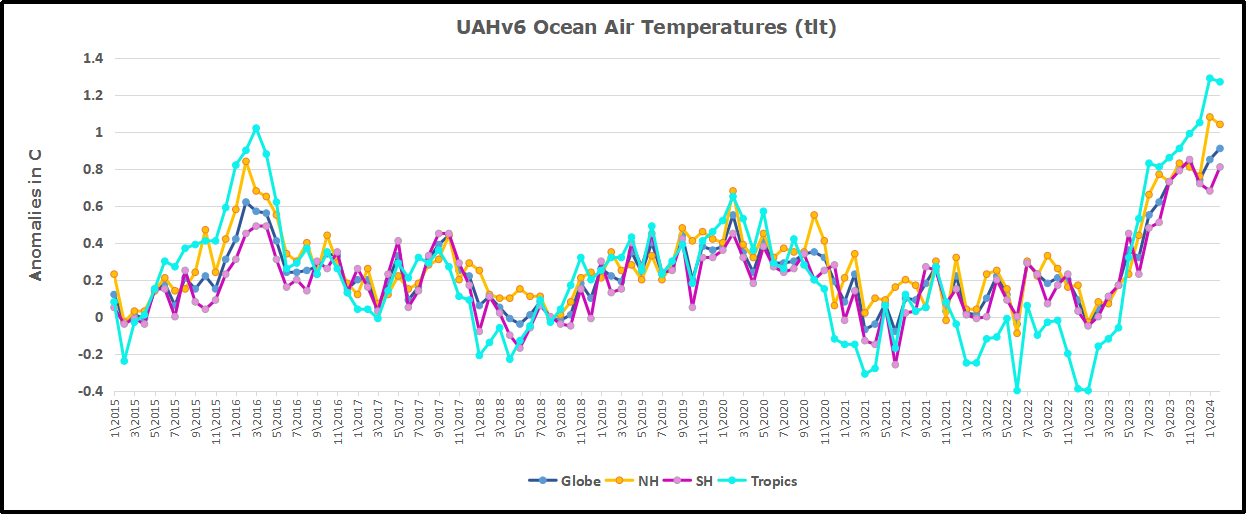
The UAH dataset includes temperature results for air above the oceans, and thus should be most comparable to the SSTs. There is the additional feature that ocean air temps avoid Urban Heat Islands (UHI).  The graph below shows monthly anomalies for ocean air temps since January 2015.

Note 2020 was warmed mainly by a spike in February in all regions, and secondarily by an October spike in NH alone. In 2021, SH and the Tropics both pulled the Global anomaly down to a new low in April. Then SH and Tropics upward spikes, along with NH warming brought Global temps to a peak in October.  That warmth was gone as November 2021 ocean temps plummeted everywhere. After an upward bump 01/2022 temps reversed and plunged downward in June.  After an upward spike in July, ocean air everywhere cooled in August and also in September.   

After sharp cooling everywhere in January 2023, all regions were into negative territory. Note the Tropics matched the lowest value, but since have spiked sharply upward +1.7C, with the largest increases in April to July, and continuing through adding to a new high January 2024. NH also spiked upward to a new high, while Global ocean rise was more modest due to slight SH cooling. In February, NH and Tropics cooled slightly, while greater warming in SH resulted in a small Global rise. Now in March both NH and SH cooled, pulling down the Global anomaly despite a persisting peak in the Tropics.

Land Air Temperatures Tracking in Seesaw Pattern

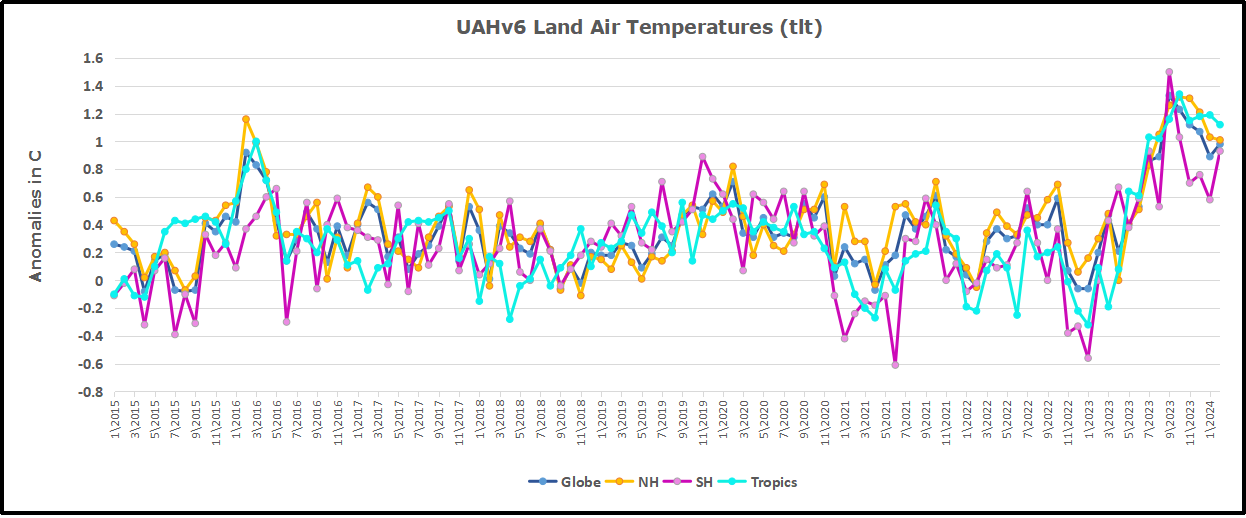
We sometimes overlook that in climate temperature records, while the oceans are measured directly with SSTs, land temps are measured only indirectly.  The land temperature records at surface stations sample air temps at 2 meters above ground.  UAH gives tlt anomalies for air over land separately from ocean air temps.  The graph updated for March is below.

Here we have fresh evidence of the greater volatility of the Land temperatures, along with extraordinary departures by SH land.  Land temps are dominated by NH with a 2021 spike in January,  then dropping before rising in the summer to peak in October 2021. As with the ocean air temps, all that was erased in November with a sharp cooling everywhere.  After a summer 2022 NH spike, land temps dropped everywhere, and in January, further cooling in SH and Tropics offset by an uptick in NH. 

Remarkably, in 2023, SH land air anomaly shot up 2.1C, from  -0.6C in January to +1.5 in September, then dropped sharply to 0.6 in January 2024, matching the SH peak in 2016. Now in February and March SH anomaly jumped up nearly 0.7C, and Tropics went up to a new high of 1.5C, pulling up the Global land anomaly to match 10/2023.

The Bigger Picture UAH Global Since 1980

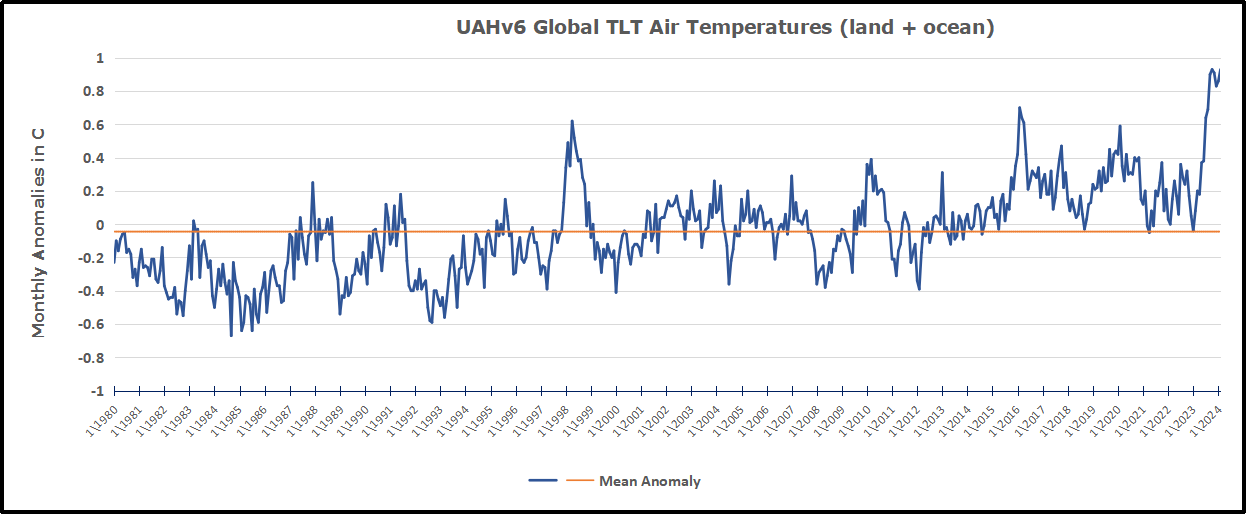
The chart shows monthly Global anomalies starting 01/1980 to present.  The average monthly anomaly is -0.04, for this period of more than four decades.  The graph shows the 1998 El Nino after which the mean resumed, and again after the smaller 2010 event. The 2016 El Nino matched 1998 peak and in addition NH after effects lasted longer, followed by the NH warming 2019-20.   An upward bump in 2021 was reversed with temps having returned close to the mean as of 2/2022.  March and April brought warmer Global temps, later reversed

With the sharp drops in Nov., Dec. and January 2023 temps, there was no increase over 1980. Then in 2023 the buildup to the October/November peak exceeded the sharp April peak of the El Nino 1998 event. It also surpassed the February peak in 2016.  December and January were down slightly, and now March is matching the October peak. Where it goes from here, up or down further, remains to be seen, though there is evidence that El Nino is weakening.

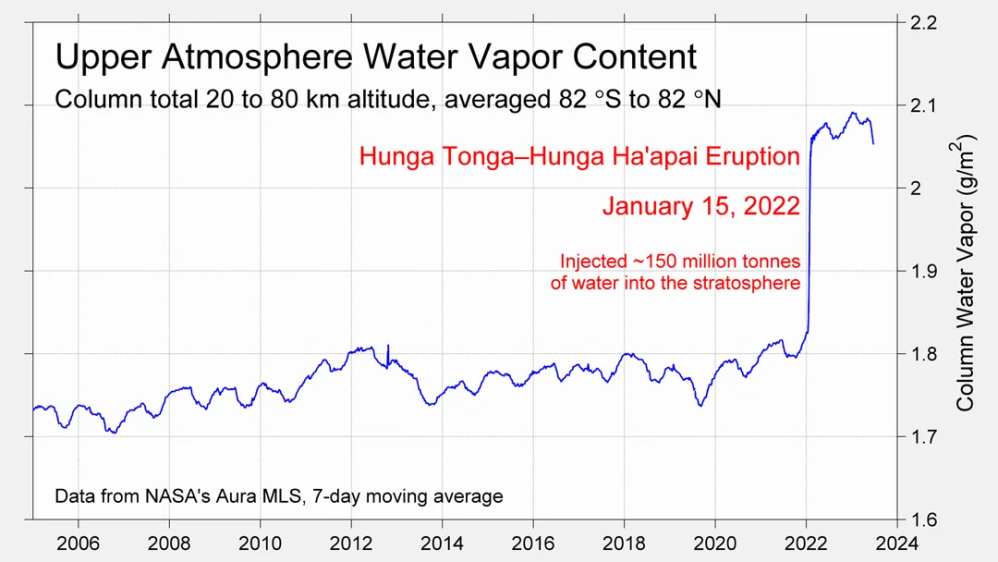
The graph reminds of another chart showing the abrupt ejection of humid air from Hunga Tonga eruption.

TLTs include mixing above the oceans and probably some influence from nearby more volatile land temps.  Clearly NH and Global land temps have been dropping in a seesaw pattern, nearly 1C lower than the 2016 peak.  Since the ocean has 1000 times the heat capacity as the atmosphere, that cooling is a significant driving force.  TLT measures started the recent cooling later than SSTs from HadSST4, but are now showing the same pattern. Despite the three El Ninos, their warming has not persisted prior to 2023, and without them it would probably have cooled since 1995.  Of course, the future has not yet been written.


UAH February 2024: SH Saves Global Warming

The post below updates the UAH record of air temperatures over land and ocean. Each month and year exposes again the growing disconnect between the real world and the Zero Carbon zealots.  It is as though the anti-hydrocarbon band wagon hopes to drown out the data contradicting their justification for the Great Energy Transition.  Yes, there has been warming from an El Nino buildup coincidental with North Atlantic warming, but no basis to blame it on CO2.  

As an overview consider how recent rapid cooling  completely overcame the warming from the last 3 El Ninos (1998, 2010 and 2016).  The UAH record shows that the effects of the last one were gone as of April 2021, again in November 2021, and in February and June 2022  At year end 2022 and continuing into 2023 global temp anomaly matched or went lower than average since 1995, an ENSO neutral year. (UAH baseline is now 1991-2020). Now we have an usual El Nino warming spike of uncertain cause, but unrelated to steadily rising CO2.

For reference I added an overlay of CO2 annual concentrations as measured at Mauna Loa.  While temperatures fluctuated up and down ending flat, CO2 went up steadily by ~60 ppm, a 15% increase.

Furthermore, going back to previous warmings prior to the satellite record shows that the entire rise of 0.8C since 1947 is due to oceanic, not human activity.

gmt-warming-events

The animation is an update of a previous analysis from Dr. Murry Salby.  These graphs use Hadcrut4 and include the 2016 El Nino warming event.  The exhibit shows since 1947 GMT warmed by 0.8 C, from 13.9 to 14.7, as estimated by Hadcrut4.  This resulted from three natural warming events involving ocean cycles. The most recent rise 2013-16 lifted temperatures by 0.2C.  Previously the 1997-98 El Nino produced a plateau increase of 0.4C.  Before that, a rise from 1977-81 added 0.2C to start the warming since 1947.

Importantly, the theory of human-caused global warming asserts that increasing CO2 in the atmosphere changes the baseline and causes systemic warming in our climate.  On the contrary, all of the warming since 1947 was episodic, coming from three brief events associated with oceanic cycles. And now in 2023 we are seeing an amazing episode with a temperature spike driven by ocean air warming in all regions, with some cooling the last two months. 

Update August 3, 2021

Chris Schoeneveld has produced a similar graph to the animation above, with a temperature series combining HadCRUT4 and UAH6. H/T WUWT

image-8


mc_wh_gas_web20210423124932

See Also Worst Threat: Greenhouse Gas or Quiet Sun?

February 2024 SH Warming Overcomes Cooling Elsewhere

banner-blog

With apologies to Paul Revere, this post is on the lookout for cooler weather with an eye on both the Land and the Sea.  While you heard a lot about 2020-21 temperatures matching 2016 as the highest ever, that spin ignores how fast the cooling set in.  The UAH data analyzed below shows that warming from the last El Nino had fully dissipated with chilly temperatures in all regions. After a warming blip in 2022, land and ocean temps dropped again with 2023 starting below the mean since 1995.  Spring and Summer 2023 saw a series of warmings, continuing into October, but with cooling since. 

UAH has updated their tlt (temperatures in lower troposphere) dataset for February 2024. Posts on their reading of ocean air temps this month comes just after updated records from HadSST4.  I posted yesterday on SSTs using HadSST4 Ocean Cools as El Nino Recedes February 2024. This month also has a separate graph of land air temps because the comparisons and contrasts are interesting as we contemplate possible cooling in coming months and years.

Sometimes air temps over land diverge from ocean air changes.  November 2023 was notable for a dichotomy between Ocean and Land air temperatures in UAH dataset. Remarkably a new high for Ocean air temps appeared with warming in all regions, while Land air temps dropped with cooling in all regions.  As a result the Global Ocean and Land anomaly result remained little changed. Last month in February 2024, both ocean and land air temps went higher driven by SH, while NH and the Tropics cooled slightly, resulting in Global anomaly matching October 2023 peak.

Note:  UAH has shifted their baseline from 1981-2010 to 1991-2020 beginning with January 2021.  In the charts below, the trends and fluctuations remain the same but the anomaly values changed with the baseline reference shift.

Presently sea surface temperatures (SST) are the best available indicator of heat content gained or lost from earth’s climate system.  Enthalpy is the thermodynamic term for total heat content in a system, and humidity differences in air parcels affect enthalpy.  Measuring water temperature directly avoids distorted impressions from air measurements.  In addition, ocean covers 71% of the planet surface and thus dominates surface temperature estimates.  Eventually we will likely have reliable means of recording water temperatures at depth.

Recently, Dr. Ole Humlum reported from his research that air temperatures lag 2-3 months behind changes in SST.  Thus cooling oceans portend cooling land air temperatures to follow.  He also observed that changes in CO2 atmospheric concentrations lag behind SST by 11-12 months.  This latter point is addressed in a previous post Who to Blame for Rising CO2?

After a change in priorities, updates are now exclusive to HadSST4.  For comparison we can also look at lower troposphere temperatures (TLT) from UAHv6 which are now posted for February.  The temperature record is derived from microwave sounding units (MSU) on board satellites like the one pictured above. Recently there was a change in UAH processing of satellite drift corrections, including dropping one platform which can no longer be corrected. The graphs below are taken from the revised and current dataset.

The UAH dataset includes temperature results for air above the oceans, and thus should be most comparable to the SSTs. There is the additional feature that ocean air temps avoid Urban Heat Islands (UHI).  The graph below shows monthly anomalies for ocean air temps since January 2015.

Note 2020 was warmed mainly by a spike in February in all regions, and secondarily by an October spike in NH alone. In 2021, SH and the Tropics both pulled the Global anomaly down to a new low in April. Then SH and Tropics upward spikes, along with NH warming brought Global temps to a peak in October.  That warmth was gone as November 2021 ocean temps plummeted everywhere. After an upward bump 01/2022 temps reversed and plunged downward in June.  After an upward spike in July, ocean air everywhere cooled in August and also in September.   

After sharp cooling everywhere in January 2023, all regions were into negative territory. Note the Tropics matched the lowest value, but since have spiked sharply upward +1.7C, with the largest increases in April to July, and continuing through adding to a new high January 2024. NH also spiked upward to a new high, while Global ocean rise was more modest due to slight SH cooling.  Now in February, NH and Tropics have cooled slightly, while greater warming in SH resulting in a small Global rise.

Land Air Temperatures Tracking in Seesaw Pattern

We sometimes overlook that in climate temperature records, while the oceans are measured directly with SSTs, land temps are measured only indirectly.  The land temperature records at surface stations sample air temps at 2 meters above ground.  UAH gives tlt anomalies for air over land separately from ocean air temps.  The graph updated for February is below.

Here we have fresh evidence of the greater volatility of the Land temperatures, along with extraordinary departures by SH land.  Land temps are dominated by NH with a 2021 spike in January,  then dropping before rising in the summer to peak in October 2021. As with the ocean air temps, all that was erased in November with a sharp cooling everywhere.  After a summer 2022 NH spike, land temps dropped everywhere, and in January, further cooling in SH and Tropics offset by an uptick in NH. 

Remarkably, in 2023, SH land air anomaly shot up 2.1C, from  -0.6C in January to +1.5 in September, then dropped sharply to 0.6 in January 2024, matching the SH peak in 2016. Now in February SH anomaly jumped up nearly 0.4C, pulling up the Global land anomaly despite continuing cooling elsewhere.

The Bigger Picture UAH Global Since 1980

The chart shows monthly Global anomalies starting 01/1980 to present.  The average monthly anomaly is -0.04, for this period of more than four decades.  The graph shows the 1998 El Nino after which the mean resumed, and again after the smaller 2010 event. The 2016 El Nino matched 1998 peak and in addition NH after effects lasted longer, followed by the NH warming 2019-20.   An upward bump in 2021 was reversed with temps having returned close to the mean as of 2/2022.  March and April brought warmer Global temps, later reversed

With the sharp drops in Nov., Dec. and January 2023 temps, there was no increase over 1980. Then in 2023 the buildup to the October/November peak exceeded the sharp April peak of the El Nino 1998 event. It also surpassed the February peak in 2016.  December and January were down slightly, and now February is matching the October peak. Where it goes from here, up or down further, remains to be seen, though there is evidence that El Nino is weakening.

The graph reminds of another chart showing the abrupt ejection of humid air from Hunga Tonga eruption.

TLTs include mixing above the oceans and probably some influence from nearby more volatile land temps.  Clearly NH and Global land temps have been dropping in a seesaw pattern, nearly 1C lower than the 2016 peak.  Since the ocean has 1000 times the heat capacity as the atmosphere, that cooling is a significant driving force.  TLT measures started the recent cooling later than SSTs from HadSST4, but are now showing the same pattern. Despite the three El Ninos, their warming has not persisted prior to 2023, and without them it would probably have cooled since 1995.  Of course, the future has not yet been written.


UAH January 2024: Ocean Warm, Land Cooling

The post below updates the UAH record of air temperatures over land and ocean. Each month and year exposes again the growing disconnect between the real world and the Zero Carbon zealots.  It is as though the anti-hydrocarbon band wagon hopes to drown out the data contradicting their justification for the Great Energy Transition.  Yes, there has been warming from an El Nino buildup coincidental with North Atlantic warming, but no basis to blame it on CO2.  

As an overview consider how recent rapid cooling  completely overcame the warming from the last 3 El Ninos (1998, 2010 and 2016).  The UAH record shows that the effects of the last one were gone as of April 2021, again in November 2021, and in February and June 2022  At year end 2022 and continuing into 2023 global temp anomaly matched or went lower than average since 1995, an ENSO neutral year. (UAH baseline is now 1991-2020). Now we have an usual El Nino warming spike of uncertain cause, but unrelated to steadily rising CO2.

For reference I added an overlay of CO2 annual concentrations as measured at Mauna Loa.  While temperatures fluctuated up and down ending flat, CO2 went up steadily by ~60 ppm, a 15% increase.

Furthermore, going back to previous warmings prior to the satellite record shows that the entire rise of 0.8C since 1947 is due to oceanic, not human activity.

gmt-warming-events

The animation is an update of a previous analysis from Dr. Murry Salby.  These graphs use Hadcrut4 and include the 2016 El Nino warming event.  The exhibit shows since 1947 GMT warmed by 0.8 C, from 13.9 to 14.7, as estimated by Hadcrut4.  This resulted from three natural warming events involving ocean cycles. The most recent rise 2013-16 lifted temperatures by 0.2C.  Previously the 1997-98 El Nino produced a plateau increase of 0.4C.  Before that, a rise from 1977-81 added 0.2C to start the warming since 1947.

Importantly, the theory of human-caused global warming asserts that increasing CO2 in the atmosphere changes the baseline and causes systemic warming in our climate.  On the contrary, all of the warming since 1947 was episodic, coming from three brief events associated with oceanic cycles. And now in 2023 we are seeing an amazing episode with a temperature spike driven by ocean air warming in all regions, with some cooling the last two months. 

Update August 3, 2021

Chris Schoeneveld has produced a similar graph to the animation above, with a temperature series combining HadCRUT4 and UAH6. H/T WUWT

image-8


mc_wh_gas_web20210423124932

See Also Worst Threat: Greenhouse Gas or Quiet Sun?

January 2024 El Nino Spikes Higher While Land Cools 

banner-blog

With apologies to Paul Revere, this post is on the lookout for cooler weather with an eye on both the Land and the Sea.  While you will hear a lot about 2020-21 temperatures matching 2016 as the highest ever, that spin ignores how fast the cooling set in.  The UAH data analyzed below shows that warming from the last El Nino had fully dissipated with chilly temperatures in all regions. After a warming blip in 2022, land and ocean temps dropped again with 2023 starting below the mean since 1995.  Spring and Summer 2023 saw a series of warmings, continuing into October, but with cooling since. 

UAH has updated their tlt (temperatures in lower troposphere) dataset for January 2024. Posts on their reading of ocean air temps this month preceded updated records from HadSST4.  I last posted on SSTs using HadSST4 Ocean Warming Spike Recedes December 2023.  This month also has a separate graph of land air temps because the comparisons and contrasts are interesting as we contemplate possible cooling in coming months and years.

Sometimes air temps over land diverge from ocean air changes.  November 2023 was notable for a dichotomy between Ocean and Land air temperatures in UAH dataset. Remarkably a new high for Ocean air temps appeared with warming in all regions, while Land air temps dropped with cooling in all regions.  As a result the Global Ocean and Land anomaly result remained little changed. Now again in January 2024, ocean temps went higher driven by El Nino and NH, while all land regions cooled except for Tropics.

Note:  UAH has shifted their baseline from 1981-2010 to 1991-2020 beginning with January 2021.  In the charts below, the trends and fluctuations remain the same but the anomaly values change with the baseline reference shift.

Presently sea surface temperatures (SST) are the best available indicator of heat content gained or lost from earth’s climate system.  Enthalpy is the thermodynamic term for total heat content in a system, and humidity differences in air parcels affect enthalpy.  Measuring water temperature directly avoids distorted impressions from air measurements.  In addition, ocean covers 71% of the planet surface and thus dominates surface temperature estimates.  Eventually we will likely have reliable means of recording water temperatures at depth.

Recently, Dr. Ole Humlum reported from his research that air temperatures lag 2-3 months behind changes in SST.  Thus cooling oceans portend cooling land air temperatures to follow.  He also observed that changes in CO2 atmospheric concentrations lag behind SST by 11-12 months.  This latter point is addressed in a previous post Who to Blame for Rising CO2?

After a change in priorities, updates are now exclusive to HadSST4.  For comparison we can also look at lower troposphere temperatures (TLT) from UAHv6 which are now posted for January.  The temperature record is derived from microwave sounding units (MSU) on board satellites like the one pictured above. Recently there was a change in UAH processing of satellite drift corrections, including dropping one platform which can no longer be corrected. The graphs below are taken from the revised and current dataset.

The UAH dataset includes temperature results for air above the oceans, and thus should be most comparable to the SSTs. There is the additional feature that ocean air temps avoid Urban Heat Islands (UHI).  The graph below shows monthly anomalies for ocean air temps since January 2015.

Note 2020 was warmed mainly by a spike in February in all regions, and secondarily by an October spike in NH alone. In 2021, SH and the Tropics both pulled the Global anomaly down to a new low in April. Then SH and Tropics upward spikes, along with NH warming brought Global temps to a peak in October.  That warmth was gone as November 2021 ocean temps plummeted everywhere. After an upward bump 01/2022 temps reversed and plunged downward in June.  After an upward spike in July, ocean air everywhere cooled in August and also in September.   

After sharp cooling everywhere in January 2023, all regions were into negative territory. Note the Tropics matched the lowest value, but since have spiked sharply upward +1.7C, with the largest increases in April to July, and continuing through adding to a new high January 2024. NH also spiked upward to a new high, while Global ocean rise was more modest due to slight SH cooling.  

Land Air Temperatures Tracking in Seesaw Pattern

We sometimes overlook that in climate temperature records, while the oceans are measured directly with SSTs, land temps are measured only indirectly.  The land temperature records at surface stations sample air temps at 2 meters above ground.  UAH gives tlt anomalies for air over land separately from ocean air temps.  The graph updated for December is below.

Here we have fresh evidence of the greater volatility of the Land temperatures, along with extraordinary departures by SH land.  Land temps are dominated by NH with a 2021 spike in January,  then dropping before rising in the summer to peak in October 2021. As with the ocean air temps, all that was erased in November with a sharp cooling everywhere.  After a summer 2022 NH spike, land temps dropped everywhere, and in January, further cooling in SH and Tropics offset by an uptick in NH. 

Remarkably, in 2023, SH land air anomaly shot up 2.1C, from  -0.6C in January to +1.5 in September, then dropped sharply, now down to 0.6 in January 2024.  NH land temps have also dropped 0.3C down to 1.0C, resulting in Global land temps cooling to 0.9C, matching the peak in Feb. 2016. Land in the Tropics was unchanged in January, down slightly from its October peak.

The Bigger Picture UAH Global Since 1980

The chart shows monthly Global anomalies starting 01/1980 to present.  The average monthly anomaly is -0.05, for this period of more than four decades.  The graph shows the 1998 El Nino after which the mean resumed, and again after the smaller 2010 event. The 2016 El Nino matched 1998 peak and in addition NH after effects lasted longer, followed by the NH warming 2019-20.   An upward bump in 2021 was reversed with temps having returned close to the mean as of 2/2022.  March and April brought warmer Global temps, later reversed

With the sharp drops in Nov., Dec. and January 2023 temps, there was no increase over 1980. Now in 2023 the buildup to the October/November peak exceeded the sharp April peak of the El Nino 1998 event. It also surpassed the February peak in 2016.  December and January are down slightly, but where it goes from here, up or down further, remains to be seen.

The graph reminds of another chart showing the abrupt ejection of humid air from Hunga Tonga eruption.

TLTs include mixing above the oceans and probably some influence from nearby more volatile land temps.  Clearly NH and Global land temps have been dropping in a seesaw pattern, nearly 1C lower than the 2016 peak.  Since the ocean has 1000 times the heat capacity as the atmosphere, that cooling is a significant driving force.  TLT measures started the recent cooling later than SSTs from HadSST3, but are now showing the same pattern. Despite the three El Ninos, their warming has not persisted prior to 2023, and without them it would probably have cooled since 1995.  Of course, the future has not yet been written.


Claimed Warming Not a Fact on the Ground

Jack Hellner writes at American Thinker Taking a look at my hometown data I discover the very opposite of the ‘global warming’ narrative is true.  Excerpts in italics with my bolds and added images.

The following are actual pieces of scientific data related to Springfield, Illinois, where I live:

The warmest day recorded in January is 73 degrees Fahrenheit on January 23, 1909, so every day in January, for the last 115 years, has been colder; the warmest day ever in February is February 24, 1930, when temperatures hit 78 degrees; the warmest day in March was March 21, 1907, when the temperature hit 91 degrees.

The average high temperature in Springfield today is around 36 degrees, and this weekend we are supposed to have highs around 30 degrees below normal, with wind chills around 20 below zero.

So, after 160 years of exponential growth of all the things the green pushers
say cause warming, we are thirty degrees below normal.

Temperatures have always fluctuated cyclically and naturally. Humans have no control over them, and there is no correlation between CO2 content, crude oil use, number of vehicles, and temperatures.

Yet, here is an article from two days ago, full of worthless information and repeated talking points, all to push the radical green agenda to scare people into capitulation:

Earth shattered global heat record in ’23 and it’s flirting with warming limit, European agency says

Earth last year shattered global annual heat records, flirted with the world’s agreed-upon warming threshold and showed more signs of a feverish planet, the European climate agency said Tuesday.

The European climate agency Copernicus said the year was 1.48 degrees Celsius (2.66 degrees Fahrenheit) above pre-industrial times. That’s barely below the 1.5 degrees Celsius limit that the world hoped to stay within in the 2015 Paris climate accord to avoid the most severe effects of warming.

People with common sense and the ability to critically think should have several questions and comments about this article. First, they should point out that it is impossible to get an average global temperature unless they place the weather stations by area throughout the globe.

For example: 70 percent of the earth is covered by water, so 70% of weather stations should be placed over water to get a statistically accurate global temperature. Placing a much higher percentage of weather stations in urban areas, with cement and buildings, obviously skews the statistical results. Basically it is garbage in, garbage out.

Then they should ask why they picked the beginning of the Industrial Revolution as the starting point from which to measure. The Industrial Revolution spanned the period 1760–1840, which was during the little ice age. So, if you pick a cold period to start from, you exaggerate the change to push the agenda.

Why didn’t they start with the medieval warming period,
where the temperature was like today? The reason they don’t
is that it wouldn’t scare people into capitulation.

Why don’t they recognize the cooling period from 1940-1975 as disproving their theory that our use of natural resources causes warming? Because facts haven’t mattered in a long time.

One sentence that I find humorous is where people got together and decided exactly what the earth’s maximum temperature should be: “Earth last year shattered global annual heat records, flirted with the world’s agreed-upon warming threshold….”

Did they have a multiple-choice question? We will be able to adapt. It is pure arrogance when politicians, bureaucrats, the United Nations, and others pretend they can control temperatures, sea levels, and storm activity.

There are too many natural variables that we can’t control or predict. What people will never see in these articles that seek to scare people into capitulation is any actual scientific data that shows a direct link between our use of oil, coal, natural gas, methane, number of gas-powered vehicles, and temperature, or any other climate statistic because… there is none. But they don’t care.

The goal has always been to transfer money and freedom from the people
to the government and green pushers. They are greedy! It is a massive scam!

See also:

Temperature records from around the world do not support
the assumption that today’s temperatures are unusual.

The Climate Story (Illustrated)

Resources for Climate History Where You Live

June 2023 the Hottest Ever? Not So Fast!


UAH December 2023: Cooling Despite El Nino Spike

The post below updates the UAH record of air temperatures over land and ocean. Each month and year exposes again the growing disconnect between the real world and the Zero Carbon zealots.  It is as though the anti-hydrocarbon band wagon hopes to drown out the data contradicting their justification for the Great Energy Transition.  Yes, there has been warming from an El Nino buildup coincidental with North Atlantic warming, but no basis to blame it on CO2.  

As an overview consider how recent rapid cooling  completely overcame the warming from the last 3 El Ninos (1998, 2010 and 2016).  The UAH record shows that the effects of the last one were gone as of April 2021, again in November 2021, and in February and June 2022  At year end 2022 and continuing into 2023 global temp anomaly matched or went lower than average since 1995, an ENSO neutral year. (UAH baseline is now 1991-2020). Now we have an usual El Nino warming spike of uncertain cause, but unrelated to steadily rising CO2.

For reference I added an overlay of CO2 annual concentrations as measured at Mauna Loa.  While temperatures fluctuated up and down ending flat, CO2 went up steadily by ~60 ppm, a 15% increase.

Furthermore, going back to previous warmings prior to the satellite record shows that the entire rise of 0.8C since 1947 is due to oceanic, not human activity.

gmt-warming-events

The animation is an update of a previous analysis from Dr. Murry Salby.  These graphs use Hadcrut4 and include the 2016 El Nino warming event.  The exhibit shows since 1947 GMT warmed by 0.8 C, from 13.9 to 14.7, as estimated by Hadcrut4.  This resulted from three natural warming events involving ocean cycles. The most recent rise 2013-16 lifted temperatures by 0.2C.  Previously the 1997-98 El Nino produced a plateau increase of 0.4C.  Before that, a rise from 1977-81 added 0.2C to start the warming since 1947.

Importantly, the theory of human-caused global warming asserts that increasing CO2 in the atmosphere changes the baseline and causes systemic warming in our climate.  On the contrary, all of the warming since 1947 was episodic, coming from three brief events associated with oceanic cycles. And now in 2023 we are seeing an amazing episode with a temperature spike driven by ocean air warming in all regions, with some cooling the last two months. 

Update August 3, 2021

Chris Schoeneveld has produced a similar graph to the animation above, with a temperature series combining HadCRUT4 and UAH6. H/T WUWT

image-8


mc_wh_gas_web20210423124932

See Also Worst Threat: Greenhouse Gas or Quiet Sun?

December 2023 Cooling Despite El Nino Spike

banner-blog

With apologies to Paul Revere, this post is on the lookout for cooler weather with an eye on both the Land and the Sea.  While you will hear a lot about 2020-21 temperatures matching 2016 as the highest ever, that spin ignores how fast the cooling set in.  The UAH data analyzed below shows that warming from the last El Nino had fully dissipated with chilly temperatures in all regions. After a warming blip in 2022, land and ocean temps dropped again with 2023 starting below the mean since 1995.  Spring and Summer 2023 saw a series of warmings, continuing into October, but with cooling since. 

UAH has updated their tlt (temperatures in lower troposphere) dataset for December 2023. Posts on their reading of ocean air temps this month preceded updated records from HadSST4.  I last posted on SSTs using HadSST4 November 2023 Ocean Warmth Persists Due to Tropics This month also has a separate graph of land air temps because the comparisons and contrasts are interesting as we contemplate possible cooling in coming months and years.

Sometimes air temps over land diverge from ocean air changes.  November 2023 was notable for a dichotomy between Ocean and Land air temperatures in UAH dataset. Remarkably a new high for Ocean air temps appeared with warming in all regions, while Land air temps dropped with cooling in all regions.  As a result the Global Ocean and Land anomaly result remained little changed. Now in December, all regions cooled except for Tropics.

Note:  UAH has shifted their baseline from 1981-2010 to 1991-2020 beginning with January 2021.  In the charts below, the trends and fluctuations remain the same but the anomaly values change with the baseline reference shift.

Presently sea surface temperatures (SST) are the best available indicator of heat content gained or lost from earth’s climate system.  Enthalpy is the thermodynamic term for total heat content in a system, and humidity differences in air parcels affect enthalpy.  Measuring water temperature directly avoids distorted impressions from air measurements.  In addition, ocean covers 71% of the planet surface and thus dominates surface temperature estimates.  Eventually we will likely have reliable means of recording water temperatures at depth.

Recently, Dr. Ole Humlum reported from his research that air temperatures lag 2-3 months behind changes in SST.  Thus cooling oceans portend cooling land air temperatures to follow.  He also observed that changes in CO2 atmospheric concentrations lag behind SST by 11-12 months.  This latter point is addressed in a previous post Who to Blame for Rising CO2?

After a change in priorities, updates are now exclusive to HadSST4.  For comparison we can also look at lower troposphere temperatures (TLT) from UAHv6 which are now posted for December.  The temperature record is derived from microwave sounding units (MSU) on board satellites like the one pictured above. Recently there was a change in UAH processing of satellite drift corrections, including dropping one platform which can no longer be corrected. The graphs below are taken from the revised and current dataset.

The UAH dataset includes temperature results for air above the oceans, and thus should be most comparable to the SSTs. There is the additional feature that ocean air temps avoid Urban Heat Islands (UHI).  The graph below shows monthly anomalies for ocean air temps since January 2015.

Note 2020 was warmed mainly by a spike in February in all regions, and secondarily by an October spike in NH alone. In 2021, SH and the Tropics both pulled the Global anomaly down to a new low in April. Then SH and Tropics upward spikes, along with NH warming brought Global temps to a peak in October.  That warmth was gone as November 2021 ocean temps plummeted everywhere. After an upward bump 01/2022 temps reversed and plunged downward in June.  After an upward spike in July, ocean air everywhere cooled in August and also in September.   

After sharp cooling everywhere in January 2023, all regions were into negative territory. Note the Tropics matched the lowest value, but since have spiked sharply upward +1.5C, with the largest increases in April to July, and continuing through to December 2023.  But now both SH and NH have dropped in December, pulling the global average back down despite the El Nino spike in the Tropics.

Land Air Temperatures Tracking in Seesaw Pattern

We sometimes overlook that in climate temperature records, while the oceans are measured directly with SSTs, land temps are measured only indirectly.  The land temperature records at surface stations sample air temps at 2 meters above ground.  UAH gives tlt anomalies for air over land separately from ocean air temps.  The graph updated for December is below.

Here we have fresh evidence of the greater volatility of the Land temperatures, along with extraordinary departures by SH land.  Land temps are dominated by NH with a 2021 spike in January,  then dropping before rising in the summer to peak in October 2021. As with the ocean air temps, all that was erased in November with a sharp cooling everywhere.  After a summer 2022 NH spike, land temps dropped everywhere, and in January, further cooling in SH and Tropics offset by an uptick in NH. 

Remarkably, in 2023, SH land air anomaly shot up 2.1C, from  -0.6C in January to +1.5 in October, then dropped to 0.7 in November, 0.76 in December.  Tropical land temps are up 1.6 since January and NH Land air temps rose 0.9, mostly since May.  Now in December SH land air temps are little changed while the drop in NH brought the Global anomaly down despite another uptick in Tropical land temps. 

The Bigger Picture UAH Global Since 1980

The chart shows monthly Global anomalies starting 01/1980 to present.  The average monthly anomaly is -0.05, for this period of more than four decades.  The graph shows the 1998 El Nino after which the mean resumed, and again after the smaller 2010 event. The 2016 El Nino matched 1998 peak and in addition NH after effects lasted longer, followed by the NH warming 2019-20.   An upward bump in 2021 was reversed with temps having returned close to the mean as of 2/2022.  March and April brought warmer Global temps, later reversed

With the sharp drops in Nov., Dec. and January 2023 temps, there was no increase over 1980. Now in 2023 the buildup to the October/November peak exceeded the sharp April peak of the El Nino 1998 event. It also surpassed the February peak in 2016.  December is down slightly, but where it goes from here, up or down further, remains to be seen.

The graph reminds of another chart showing the abrupt ejection of humid air from Hunga Tonga eruption.

TLTs include mixing above the oceans and probably some influence from nearby more volatile land temps.  Clearly NH and Global land temps have been dropping in a seesaw pattern, nearly 1C lower than the 2016 peak.  Since the ocean has 1000 times the heat capacity as the atmosphere, that cooling is a significant driving force.  TLT measures started the recent cooling later than SSTs from HadSST3, but are now showing the same pattern. Despite the three El Ninos, their warming has not persisted prior to 2023, and without them it would probably have cooled since 1995.  Of course, the future has not yet been written.


2024 Oceanic Climate Warming At Work

David Wojick describes how ocean cycles create warming blips in global temperature records in his concise, plain language CFACT article Big temperature spike may lead to small temperature rise.  Excerpts in italics with my bolds and added images.

The recent big temperature spike has the climate alarmists all excited, pulling out all the hyperbolic stops as it were. The warming is huge they say. Their favorite descriptor — unprecedented — appears frequently.

Which makes it all very funny, since we had exactly this same situation not that long ago. What is most interesting is what happened next back then, because in my view it is likely to happen again. Let me explain.

For what follows you need to be looking at the UAH temperature record, which is here:

First of all compare the ongoing spike now with the 1998 spike. They are virtually identical as far as the short term temperature increase is concerned, roughly 1.0 degrees C. So as spikes go there is nothing unprecedented.

Yes the tip of the now spike is at a higher temperature that the 1998 spike and this is where is gets very interesting. The base of the now spike is warmer than the base was in 1998. This is because there has been a little bit of warming since then.

But all of that warming has occurred in two specific steps up, each following a super El Niño. After the 1998 spike the temperature oscillated around a constant value that was warmer than before the spike but there was no additional warming until the 2016 super El Niño spike came along. Then after that spike it was again warmer but with no warming.

All the warming in the entire record occurs in just two steps with no warming in between. For the record I first pointed out this step pattern six years ago, when there was just one clear step, the 1998. See No CO2 warming for the last 40 years

At the time we were wondering if this step pattern would repeat with the 2016 super El Niño and by golly it did.

So now the question is will we get another little step up in average temperature from the ongoing spike? My bet is it will so, Of course I am prepared to be wrong but it is still very likely.  But the basic point from six years ago remains.

There is no evidence of any warming due to the ongoing steady CO2
increase in this entire 45 year record. None whatsoever as it is
all clearly to do with the periodic occurrence of super El Niños.

The likely explanation also seems pretty simple. There is residual energy in the atmosphere left over from each spike. So the total energy goes up with each step.

Note that the energy in the spike does not come from the El Niño. An El Niño is simply a lack of cold water upwelling. Without that cold water the ocean surface layer gets a lot warmer from the incoming solar energy. Some of that energy goes into the atmosphere creating the big spike. That some of it would then hang around does not seem surprising. There is no reason why the La Niña that follows each super El Niño should remove all recently added energy.

Here is my conclusion from six years ago: “But in no case is there any evidence of CO2 induced warming here, nor of any human-caused warming for that matter. These causes would produce a relatively steady warming over time, not the single episodic warming that we clearly see here. In particular, to my knowledge there is no known way that the gradual CO2 increase could have caused this giant El Nino-La Nina cycle.

Thus the little warming that there is in the last 40 years appears to be more or less entirely natural. In any normal science this result would be sufficient to invalidate the hypothesis that the increasing CO2 concentration is causing global warming.”

Nothing has changed. The hypothesis of anthropogenic global warming
is falsified by simple observation. Science is like that, or should be.

Addendum:

The stairstep warming also appears in HadSST4 global ocean temperature dataset, with the suggestion that a new plateau may be in place.

Since Hadcrut4 (ocean + land) goes back early in the 20th century, we can see the same pattern from an earlier analysis updated to today. Going back to previous warmings prior to the satellite record shows that the entire rise of 0.8C since 1947 is due to oceanic, not human activity.

The animation is an update of a previous analysis from Dr. Murry Salby.  These graphs use Hadcrut4 and include the 2016 El Nino warming event.  The exhibit shows since 1947 GMT warmed by 0.8 C, from 13.9 to 14.7, as estimated by Hadcrut4.  This resulted from three natural warming events involving ocean cycles. The most recent rise 2013-16 lifted temperatures by 0.2C.  Previously the 1997-98 El Nino produced a plateau increase of 0.4C.  Before that, a rise from 1977-81 added 0.2C to start the warming since 1947.

Importantly, the theory of human-caused global warming asserts that increasing CO2 in the atmosphere changes the baseline and causes systemic warming in our climate.  On the contrary, all of the warming since 1947 was episodic, coming from three brief events associated with oceanic cycles. And now in 2023 we are seeing an amazing episode with a temperature spike driven by ocean air warming in all regions.

Footnote:

As David stated and diagramed so well, ENSO (El Nino Southern Oscillation) ocean cycle has driven this contemporary warming of atmospheric temperatures.  But we should also note how the Northern Atlantic has contributed to this effect, both in 2016 and currently.

To enlarge open image in new tab.

Note that in 2015-2016 the Tropics and SH peaked in between two summer NH spikes.  That pattern repeated in 2019-2020 with a lesser Tropics peak and SH bump, but with higher NH spikes. By end of 2020, cooler SSTs in all regions took the Global anomaly well below the mean for this period.  Then in 2023 we see the Tropical peaking from El Nino at the same time as the remarkable NH spike, raising the Global ocean anomaly to a new high.

Additional evidence for North Atlantic warming comes from the AMO index (Atlantic Multi-decadal Oscillation).  ERSSTv5 AMO dataset uses the NA region EQ-60°N, 0°-80°W and subtracts the global rise of SST 60°S-60°N to obtain a measure of the internal variability of NA. So the values represent SST anomaly differences between the N. Atlantic and the Global ocean.

The chart shows the outlier 2023 spike peaking in the North Atlantic in July, persisting through October, before dropping November and December. Note how much higher are these anomalies compared to 2016 in purple.  Note also that August typically has the highest NA ocean temperatures, so these anomalies are on top of the highest actual temperatures recorded.

It remains to be seen how long this warming will persist, and what will be the longer term effect, but as David explained, it all has nothing to do with CO2.

Winter Solstice Teaches Us About Climate Change

With Winter Solstice due this week (December 21) the shortest NH day of the year demonstrates the sun’s role in seasonal climate change.  I am reposting an analysis looking into global warming in relation to our empirical knowledge of solar orbital patterns.

From Previous Post When Is It Warming?

On June 21, 2015 E.M. Smith made an intriguing comment on the occasion of Summer Solstice (NH) and Winter Solstice (SH):

“This is the time when the sun stops the apparent drift in the sky toward one pole, reverses, and heads toward the other. For about 2 more months, temperatures lag this change of trend. That is the total heat storage capacity of the planet. Heat is not stored beyond that point and there can not be any persistent warming as long as winter brings a return to cold.

I’d actually assert that there are only two measurements needed to show the existence or absence of global warming. Highs in the hottest month must get hotter and lows in the coldest month must get warmer. BOTH must happen, and no other months matter as they are just transitional.

I’m also pretty sure that the comparison of dates of peaks between locations could also be interesting. If one hemisphere is having a drift to, say, longer springs while the other is having longer falls, that’s more orbital mechanics than CO2 driven and ought to be reflected in different temperature trends / rates of drift.” Source: Summer Solstice is here at chiefio

Monthly Temps NH and SH

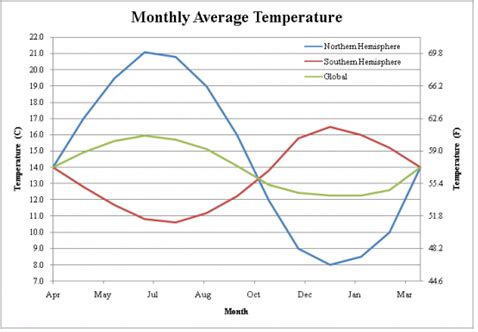
Notice that the global temperature tracks with the seasons of the NH. The reason for this is simple. The NH has twice as much land as the Southern Hemisphere (SH). Oceans have greater heat capacity and thus do not change temperatures as much as land does. So every year when there is almost a 4 °C swing in the temperature of the Earth, it follows the seasons of the NH. This is especially interesting because the Earth gets the most energy from the sun in January presently. That is because of the orbit of the Earth. The perihelion is when the Earth is closest to the sun and that currently takes place in January.

sun-distances

Observations and Analysis:

At the time my curiosity was piqued by Chiefio’s comment, so I went looking for data to analyze to test his proposition. As it happens, Berkeley Earth provides data tables for monthly Tmax and Tmin by hemisphere (NH and SH), from land station records. Setting aside any concerns about adjustments or infilling I did the analysis taking the BEST data tables at face value. Since land surface temperatures are more variable than sea surface temps, it seems like a reasonable dataset to analyze for the mentioned patterns. In the analysis below, all years refers to data for the years 1877 through 2013.

Tmax Records

NH and SH long-term trends are the same 0.07C/decade, and in both there was cooling before 1979 and above average warming since. However, since 1950 NH warmed more strongly, and mostly prior to 1998, while SH has warmed strongly since 1998. (Trends below are in C/yr.)

 Tmax Trends NH Tmax SH Tmax
All years 0.007 0.007
1998-2013 0.018 0.030
1979-1998 0.029 0.017
1950-1979 -0.003 -0.003
1950-2013 0.020 0.014

Summer Comparisons:

NH summer months are June, July, August, (6-8) and SH summer is December, January, February (12-2). The trends for each of those months were computed and the annual trends subtracted to show if summer months were warming more than the rest of the year (Trends below are in C/yr.).

Month less Annual NH
Tmax
NH Tmax NH Tmax SH Tmax SH Tmax SH Tmax
Summer Trends

6

7 8 12 1

2

All years -0.002 -0.004 -0.004 0.000 0.003 0.002
1998-2013 0.026 0.002 0.006 0.022 0.004 -0.029
1979-1998 0.003 -0.004 -0.003 -0.014 -0.029 0.001
1950-1979 -0.002 -0.002 -0.005 0.004 0.005 -0.005
1950-2013 -0.002 -0.003 -0.002 -0.002 -0.002 -0.002

NH summer months are cooler than average overall and since 1950. Warming does appear since 1998 with a large anomaly in June and also warming in August.  SH shows no strong pattern of Tmax warming in summer months. A hot December trend since 1998 is offset by a cold February. Overall SH summers are just above average, and since 1950 have been slightly cooler.

Tmin Records

Both NH and SH show Tmin rising 0.12C/decade, much more strongly warming than Tmax. SH shows average warming persisting throughout the record, slightly higher prior to 1979. NH Tmin is more variable, showing a large jump 1979-1998, a rate of 0.25 C/decade (Trends below are in C/yr.).

 Trends NH Tmin SH Tmin
All years 0.012 0.012
1998-2013 0.010 0.010
1979-1998 0.025 0.011
1950-1979 0.006 0.014
1950-2013 0.022 0.014

Winter Comparisons:

SH winter months are June, July, August, (6-8) and NH winter is December, January, February (12-2). The trends for each of those months were computed and the annual trends subtracted to show if winter months were warming more than the rest of the year (Trends below are in C/yr.).

Month less Annual NH Tmin NH Tmin NH Tmin SH Tmin SH Tmin SH Tmin
Winter Trends

12

1 2 6 7

8

All years 0.007 0.008 0.007 0.005 0.003 0.004
1998-2013 -0.045 -0.035 -0.076 -0.043 -0.024 -0.019
1979-1998 -0.018 -0.005 0.024 0.034 0.008 -0.008
1950-1979 0.008 0.005 0.007 0.008 0.012 0.013
1950-2013 0.001 0.007 0.008 -0.001 -0.002 0.002

NH winter Tmin warming is stronger than SH Tmin trends, but shows quite strong cooling since 1998. An anomalously warm February is the exception in the period 1979-1998.  Both NH and SH show higher Tmin warming in winter months, with some irregularities. Most of the SH Tmin warming was before 1979, with strong cooling since 1998. June was anomalously warming in the period 1979 to 1998.

Summary

Tmin did trend higher in winter months but not consistently. Mostly winter Tmin warmed 1950 to 1979, and was much cooler than other months since 1998.

Tmax has not warmed in summer more than in other months, with the exception of two anomalous months since 1998: NH June and SH December.

Conclusion:

I find no convincing pattern of summer Tmax warming carrying over into winter Tmin warming. In other words, summers are not adding warming more than other seasons. There is no support for concerns over summer heat waves increasing as a pattern.

It is interesting to note that the plateau in temperatures since the 1998 El Nino is matched by winter months cooler than average during that period, leading to my discovering the real reason for lack of warming recently.

The Real Reason for the Pause in Global Warming?

These data suggest warming trends are coming from less cold overnight temperatures as measured at land weather stations. Since stations exposed to urban heat sources typically show higher minimums overnight and in winter months, this pattern is likely an artifact of human settlement activity rather than CO2 from fossil fuels.

uhi_profile-rev-big

Thus the Pause (more correctly the Plateau) in global warming is caused by end of the century completion of urbanization around most surface stations. With no additional warming from additional urban heat sources, temperatures have remained flat for more than 15 years.

Note on Data:

I thought about updating this analysis, but discovered that the BEST tables have not been updated since 2018.  The sources have also moved, now located here:

https://berkeleyearth.org/temperature-region/southern-hemisphere

https://berkeleyearth.org/temperature-region/northern-hemisphere

Happy Winter Solstice

Winter Solstice farolito labyrinth in Santa Fe

Dubai, We Have a Problem: No Global Temperature Baseline Before 1900

An article in German presents the problem:  “Warmer than at any time since records began …” – The fraud with the reference period.”  LackmustestTester at reddit provides an English synopsis explaining the serious issue of global temperature records lacking prior to 20th century. Excerpts in italics with my bolds and added images. The original in German is here.

Temperature Records Lacking Before Last Century

Well, Copernicus, as an organization financed and probably also controlled by the EU, is one of those organizations that boast about data transparency. So we have obtained the data that Samantha Burgess refers to in her heat record letter, which you can get here, and counted out which measuring stations in which parts of the world are the basis for the global average temperature calculated for the years 1850 to 1900, which serves as the basis for the alleged increase of 1.46 degrees Celsius.

Well, let’s say right away that China and Southeast Asia are completely irrelevant for the global temperature from 1850 to 1900; neither China, Japan, India, Thailand, Indonesia and the Philippines, to name but a few, appear in the “reference period from 1850 to 1900” with even a single measurement date.

But that’s not all: the global temperature, calculated for the pre-industrial period from 1850 to 1900, which has become the basis for all claims about the significant increase in temperatures, does not include any data from not only Asia, it does not include any data for South America and Africa has shrunk to Algeria, Morocco, Tunisia and Egypt in the north, and South Africa in the south.

The earth temperature of the reference period 1850 to 1900 is essentially a North American temperature, which is primarily based on measurement data from the USA: 83.4% of the temperature data for the “global temperature” of the “reference period 1850 to 1900” for the northern hemisphere originate from the USA, 75.9% of all measuring stations on the basis of which the global temperature of the “reference period 1850 to 1900” is calculated are located in the USA, and just under 10% in Canada.

Not only to conceal this bias in the data basis, but also to
pass off the temperatures calculated for the “reference period
from 1850 to 1900” as “global temperatures” is fraud.

Another way to show the bias of the data, on the basis of which one can at best make statements about the USA and Canada, is to differentiate the measuring stations into those located in the northern hemisphere and those located in the southern hemisphere. The following figure shows, among other things, the result of this comparison.

Number and locations of the measuring stations used to calculate the reference period 1850 to 1900 – blue: NH, orange: SH, grey: only US, red: cumulative values

Just 9% of the measuring stations on the basis of whose data the temperature of the reference period 1850 to 1900 is calculated, as a measure of the pre-industrial temperature that is so important for the climate cultists, are located in the southern hemisphere and there they are mainly found in Australia, apart from a few scattered measuring stations in South Africa and two measuring stations in Sri Lanka.

The Earth’s temperature is obviously a temperature that can be
calculated independently of local temperatures in India, China,
Southeast Asia, South America and large parts of Africa.

If it is possible to calculate the Earth’s temperature for the period from 1850 to 1900 without taking large parts of the Earth into account, then the question arises as to whether it is possible to do without any measurement data at all, especially as their distribution over the years is very uneven: a total of 32 measuring stations form the basis for the global Earth temperature calculation for the years 1850 to 1859, with a further 62 from 1860 to 1869. As the figure above shows, the claim that the entire period from 1850 to 1900 is a reference period is simply fraudulent, as 77% of the measuring stations were only put into operation after 1890.

This is all a huge humbug that ultimately represents scientific fraud, and anyone who compares today’s data with the data from the reference period 1850 to 1900 and claims to be able to extract any information about the development of the global earth temperature from this is either out of their depth or a climate fraudster.

Footnote from Comments

The official record Copernicus uses goes back to 1940.

Additionally, it appears that at least the NH was just emerging from a prolonged cold period – the little ice age – which would assist in providing for the lower baseline temps. All in all, it seems silly to try and make such comparisons, and even when they are done we seem to run into ‘re-analysis’ of past temp data that persistently cools the past data sets, which of course make current temps seem warmer.

It’s not only NOAA doing these adjustments, German DWD does the same thing. They also placed new stations at inappropriate sites and reduced the number of stations.

Consider the Hot Air in recent claims like these:

Humanity has just lived through the hottest 12-month period in at least 125,000 years CNN

Earth posts hottest 12 months on record and probably 125,000 years Washington Post

This year is “virtually certain” to be the warmest in 125,000 years said E U scientists Reuters

The hottest temperature that our planet has experienced in something like 125,000 years Scientific American

Earth just had its hottest year on record — climate change is to blame Nature


UAH November 2023: Ocean Stays Warm, Land Cools

The post below updates the UAH record of air temperatures over land and ocean. Each month and year exposes again the growing disconnect between the real world and the Zero Carbon zealots.  It is as though the anti-hydrocarbon band wagon hopes to drown out the data contradicting their justification for the Great Energy Transition.  Yes, there has been warming from an El Nino buildup coincidental with North Atlantic warming, but no basis to blame it on CO2.  

As an overview consider how recent rapid cooling  completely overcame the warming from the last 3 El Ninos (1998, 2010 and 2016).  The UAH record shows that the effects of the last one were gone as of April 2021, again in November 2021, and in February and June 2022  At year end 2022 and continuing into 2023 global temp anomaly matched or went lower than average since 1995, an ENSO neutral year. (UAH baseline is now 1991-2020).

For reference I added an overlay of CO2 annual concentrations as measured at Mauna Loa.  While temperatures fluctuated up and down ending flat, CO2 went up steadily by ~60 ppm, a 15% increase.

Furthermore, going back to previous warmings prior to the satellite record shows that the entire rise of 0.8C since 1947 is due to oceanic, not human activity.

gmt-warming-events

The animation is an update of a previous analysis from Dr. Murry Salby.  These graphs use Hadcrut4 and include the 2016 El Nino warming event.  The exhibit shows since 1947 GMT warmed by 0.8 C, from 13.9 to 14.7, as estimated by Hadcrut4.  This resulted from three natural warming events involving ocean cycles. The most recent rise 2013-16 lifted temperatures by 0.2C.  Previously the 1997-98 El Nino produced a plateau increase of 0.4C.  Before that, a rise from 1977-81 added 0.2C to start the warming since 1947.

Importantly, the theory of human-caused global warming asserts that increasing CO2 in the atmosphere changes the baseline and causes systemic warming in our climate.  On the contrary, all of the warming since 1947 was episodic, coming from three brief events associated with oceanic cycles. And now in 2023 we are seeing an amazing episode with a temperature spike driven by ocean air warming in all regions. 

Update August 3, 2021

Chris Schoeneveld has produced a similar graph to the animation above, with a temperature series combining HadCRUT4 and UAH6. H/T WUWT

image-8


mc_wh_gas_web20210423124932

See Also Worst Threat: Greenhouse Gas or Quiet Sun?

November 2023 Ocean Stays Warm, Land Cools

banner-blog

With apologies to Paul Revere, this post is on the lookout for cooler weather with an eye on both the Land and the Sea.  While you will hear a lot about 2020-21 temperatures matching 2016 as the highest ever, that spin ignores how fast the cooling set in.  The UAH data analyzed below shows that warming from the last El Nino had fully dissipated with chilly temperatures in all regions. After a warming blip in 2022, land and ocean temps dropped again with 2023 starting below the mean since 1995.  Spring and Summer 2023 saw a series of warmings.  Now in November the high persisted due to another rise in ocean air temps in all regions, while land air temps cooled everywhere, most strongly in SH.

UAH has updated their tlt (temperatures in lower troposphere) dataset for November 2023. Posts on their reading of ocean air temps this month preceded updated records from HadSST4.  I last posted on SSTs using HadSST4 October 2023 Ocean Cooling Off.  This month also has a separate graph of land air temps because the comparisons and contrasts are interesting as we contemplate possible cooling in coming months and years.

Sometimes air temps over land diverge from ocean air changes.  November 2023 is notable for a dichotomy between Ocean and Land air temperatures in UAH dataset. Remarkably a new high for Ocean air temps appeared with warming in all regions, while Land air temps dropped with cooling in all regions.  As a result the Global Ocean and Land anomaly result remained little changed.

Note:  UAH has shifted their baseline from 1981-2010 to 1991-2020 beginning with January 2021.  In the charts below, the trends and fluctuations remain the same but the anomaly values change with the baseline reference shift.

Presently sea surface temperatures (SST) are the best available indicator of heat content gained or lost from earth’s climate system.  Enthalpy is the thermodynamic term for total heat content in a system, and humidity differences in air parcels affect enthalpy.  Measuring water temperature directly avoids distorted impressions from air measurements.  In addition, ocean covers 71% of the planet surface and thus dominates surface temperature estimates.  Eventually we will likely have reliable means of recording water temperatures at depth.

Recently, Dr. Ole Humlum reported from his research that air temperatures lag 2-3 months behind changes in SST.  Thus cooling oceans portend cooling land air temperatures to follow.  He also observed that changes in CO2 atmospheric concentrations lag behind SST by 11-12 months.  This latter point is addressed in a previous post Who to Blame for Rising CO2?

After a change in priorities, updates are now exclusive to HadSST4.  For comparison we can also look at lower troposphere temperatures (TLT) from UAHv6 which are now posted for November.  The temperature record is derived from microwave sounding units (MSU) on board satellites like the one pictured above. Recently there was a change in UAH processing of satellite drift corrections, including dropping one platform which can no longer be corrected. The graphs below are taken from the revised and current dataset.

The UAH dataset includes temperature results for air above the oceans, and thus should be most comparable to the SSTs. There is the additional feature that ocean air temps avoid Urban Heat Islands (UHI).  The graph below shows monthly anomalies for ocean air temps since January 2015.

Note 2020 was warmed mainly by a spike in February in all regions, and secondarily by an October spike in NH alone. In 2021, SH and the Tropics both pulled the Global anomaly down to a new low in April. Then SH and Tropics upward spikes, along with NH warming brought Global temps to a peak in October.  That warmth was gone as November 2021 ocean temps plummeted everywhere. After an upward bump 01/2022 temps reversed and plunged downward in June.  After an upward spike in July, ocean air everywhere cooled in August and also in September.   

After sharp cooling everywhere in January 2023, all regions were into negative territory. Note the Tropics matched the lowest value, but since have spiked sharply upward +1.4C, with the largest increases in April to July, and continuing in Autumn 2023.  NH also warmed to 0.83C in the last 9 months, while SH ocean air rose about the same. Global Ocean air November 2023 now exceeds the 2016 peak by 0.2C, the main difference being the much higher rise in SH anomalies since June.  The strength of the El Nino will determine the pattern in coming months.

Land Air Temperatures Tracking in Seesaw Pattern

We sometimes overlook that in climate temperature records, while the oceans are measured directly with SSTs, land temps are measured only indirectly.  The land temperature records at surface stations sample air temps at 2 meters above ground.  UAH gives tlt anomalies for air over land separately from ocean air temps.  The graph updated for November is below.

Here we have fresh evidence of the greater volatility of the Land temperatures, along with extraordinary departures by SH land.  Land temps are dominated by NH with a 2021 spike in January,  then dropping before rising in the summer to peak in October 2021. As with the ocean air temps, all that was erased in November with a sharp cooling everywhere.  After a summer 2022 NH spike, land temps dropped everywhere, and in January, further cooling in SH and Tropics offset by an uptick in NH. 

Remarkably, in 2023, SH land air anomaly shot up 1.6C, from  -0.56C in January to +1.03 in October, then dropped to 0.7 in November.  Tropical land temps are up 1.6 since January and NH Land air temps rose 0.9, mostly since May.  Now in November NH land air temps are little changed and Tropical land temps down nearly 0.2C.

The Bigger Picture UAH Global Since 1980

The chart shows monthly Global anomalies starting 01/1980 to present.  The average monthly anomaly is -0.05, for this period of more than four decades.  The graph shows the 1998 El Nino after which the mean resumed, and again after the smaller 2010 event. The 2016 El Nino matched 1998 peak and in addition NH after effects lasted longer, followed by the NH warming 2019-20.   An upward bump in 2021 was reversed with temps having returned close to the mean as of 2/2022.  March and April brought warmer Global temps, later reversed.

With the sharp drops in Nov., Dec. and January 2023 temps, there was no increase over 1980. Now in 2023 the buildup to the October/November peak exceeds the sharp April peak of the El Nino 1998 event. It also surpasses the February peak in 2016.  Where it goes from here, up or down, remains to be seen.

The graph reminds of another chart showing the abrupt ejection of humid air from Hunga Tonga eruption.

TLTs include mixing above the oceans and probably some influence from nearby more volatile land temps.  Clearly NH and Global land temps have been dropping in a seesaw pattern, nearly 1C lower than the 2016 peak.  Since the ocean has 1000 times the heat capacity as the atmosphere, that cooling is a significant driving force.  TLT measures started the recent cooling later than SSTs from HadSST3, but are now showing the same pattern. Despite the three El Ninos, their warming has not persisted prior to 2023, and without them it would probably have cooled since 1995.  Of course, the future has not yet been written.


UAH: Amazing Air Warming Spike October 2023

The post below updates the UAH record of air temperatures over land and ocean. Each month and year exposed again the growing disconnect between the real world and the Zero Carbon zealots.  It is as though the anti-hydrocarbon band wagon hopes to drown out the data contradicting their justification for the Great Energy Transition.  Yes, there is warming from an El Nino buildup coincidental with North Atlantic warming, but no basis to blame it on CO2.  

As an overview consider how recent rapid cooling  completely overcame the warming from the last 3 El Ninos (1998, 2010 and 2016).  The UAH record shows that the effects of the last one were gone as of April 2021, again in November 2021, and in February and June 2022  At year end 2022 and continuing into 2023 global temp anomaly matched or went lower than average since 1995, an ENSO neutral year. (UAH baseline is now 1991-2020).

For reference I added an overlay of CO2 annual concentrations as measured at Mauna Loa.  While temperatures fluctuated up and down ending flat, CO2 went up steadily by ~60 ppm, a 15% increase.

Furthermore, going back to previous warmings prior to the satellite record shows that the entire rise of 0.8C since 1947 is due to oceanic, not human activity.

gmt-warming-events

The animation is an update of a previous analysis from Dr. Murry Salby.  These graphs use Hadcrut4 and include the 2016 El Nino warming event.  The exhibit shows since 1947 GMT warmed by 0.8 C, from 13.9 to 14.7, as estimated by Hadcrut4.  This resulted from three natural warming events involving ocean cycles. The most recent rise 2013-16 lifted temperatures by 0.2C.  Previously the 1997-98 El Nino produced a plateau increase of 0.4C.  Before that, a rise from 1977-81 added 0.2C to start the warming since 1947.

Importantly, the theory of human-caused global warming asserts that increasing CO2 in the atmosphere changes the baseline and causes systemic warming in our climate.  On the contrary, all of the warming since 1947 was episodic, coming from three brief events associated with oceanic cycles. And now in 2023 we are seeing an amazing episode with a temperature spike driven by ocean air warming along with higher land air temps.

Update August 3, 2021

Chris Schoeneveld has produced a similar graph to the animation above, with a temperature series combining HadCRUT4 and UAH6. H/T WUWT

image-8


mc_wh_gas_web20210423124932

See Also Worst Threat: Greenhouse Gas or Quiet Sun?

October 2023 Update New Warming Spike Led by Tropics High

banner-blog

With apologies to Paul Revere, this post is on the lookout for cooler weather with an eye on both the Land and the Sea.  While you will hear a lot about 2020-21 temperatures matching 2016 as the highest ever, that spin ignores how fast the cooling set in.  The UAH data analyzed below shows that warming from the last El Nino had fully dissipated with chilly temperatures in all regions. After a warming blip in 2022, land and ocean temps dropped again with 2023 starting below the mean since 1995.  Spring and Summer 2023 saw a series of warmings.  Now in October a new high resulted from a major rise in ocean air temps in all regions, along with higher land air temps in NH and Tropics. 

UAH has updated their tlt (temperatures in lower troposphere) dataset for October 2023. Posts on their reading of ocean air temps this month preceded updated records from HadSST4.  I last posted on SSTs using HadSST4 September 2023 Ocean Warming Crests, Solar Coincidence? This month also has a separate graph of land air temps because the comparisons and contrasts are interesting as we contemplate possible cooling in coming months and years. Sometimes air temps over land diverge from ocean air changes.  For example in October 2023, a new warming high was driven by ocean air temps despite SH land temps dropping back down. The Tropics and NH showed warming in both land and sea air.

In October, as shown later on, Global ocean air reached a record high peak with all regions warming, especially Tropics. Land air temps rose in NH and Tropics, with a SH dropping down.   Thus the land + ocean Global UAH temperature is now exceeding the 2016 peak.

Note:  UAH has shifted their baseline from 1981-2010 to 1991-2020 beginning with January 2021.  In the charts below, the trends and fluctuations remain the same but the anomaly values change with the baseline reference shift.

Presently sea surface temperatures (SST) are the best available indicator of heat content gained or lost from earth’s climate system.  Enthalpy is the thermodynamic term for total heat content in a system, and humidity differences in air parcels affect enthalpy.  Measuring water temperature directly avoids distorted impressions from air measurements.  In addition, ocean covers 71% of the planet surface and thus dominates surface temperature estimates.  Eventually we will likely have reliable means of recording water temperatures at depth.

Recently, Dr. Ole Humlum reported from his research that air temperatures lag 2-3 months behind changes in SST.  Thus the cooling oceans now portend cooling land air temperatures to follow.  He also observed that changes in CO2 atmospheric concentrations lag behind SST by 11-12 months.  This latter point is addressed in a previous post Who to Blame for Rising CO2?

After a change in priorities, updates are now exclusive to HadSST4.  For comparison we can also look at lower troposphere temperatures (TLT) from UAHv6 which are now posted for September.  The temperature record is derived from microwave sounding units (MSU) on board satellites like the one pictured above. Recently there was a change in UAH processing of satellite drift corrections, including dropping one platform which can no longer be corrected. The graphs below are taken from the revised and current dataset.

The UAH dataset includes temperature results for air above the oceans, and thus should be most comparable to the SSTs. There is the additional feature that ocean air temps avoid Urban Heat Islands (UHI).  The graph below shows monthly anomalies for ocean air temps since January 2015.

Note 2020 was warmed mainly by a spike in February in all regions, and secondarily by an October spike in NH alone. In 2021, SH and the Tropics both pulled the Global anomaly down to a new low in April. Then SH and Tropics upward spikes, along with NH warming brought Global temps to a peak in October.  That warmth was gone as November 2021 ocean temps plummeted everywhere. After an upward bump 01/2022 temps reversed and plunged downward in June.  After an upward spike in July, ocean air everywhere cooled in August and also in September.   

After sharp cooling everywhere in January 2023, all regions were into negative territory. Note the Tropics matched the lowest value, but since have spiked sharply upward +1.26C, with the largest increases in April to July 2023.  NH also warmed 0.7C in the last 4 months, while SH ocean air rose the same. Global Ocean air October 2023 is now exceeding 2016, the main difference being the much higher rise in SH anomalies since April.  The strength of the El Nino will determine the latter part of this year.

Land Air Temperatures Tracking Downward in Seesaw Pattern

We sometimes overlook that in climate temperature records, while the oceans are measured directly with SSTs, land temps are measured only indirectly.  The land temperature records at surface stations sample air temps at 2 meters above ground.  UAH gives tlt anomalies for air over land separately from ocean air temps.  The graph updated for September is below.

Here we have fresh evidence of the greater volatility of the Land temperatures, along with extraordinary departures by SH land.  Land temps are dominated by NH with a 2021 spike in January,  then dropping before rising in the summer to peak in October 2021. As with the ocean air temps, all that was erased in November with a sharp cooling everywhere.  After a summer 2022 NH spike, land temps dropped everywhere, and in January, further cooling in SH and Tropics offset by an uptick in NH. 

Remarkably, in 2023, SH land air anomaly shot up 1.5C, from  -0.56C in January to +0.93 in July, then dropped to 0.53 in August. In September SH shot up again to 1.5C.  Tropical land temps are up 1.48 since January and NH Land air temps rose 0.9, mostly since May. Despite SH land air dropping in October, the consolidated rise greatly exceeds the upward spikes peaking in  2016.

The Bigger Picture UAH Global Since 1980

The chart shows monthly Global anomalies starting 01/1980 to present.  The average monthly anomaly is -0.06, for this period of more than four decades.  The graph shows the 1998 El Nino after which the mean resumed, and again after the smaller 2010 event. The 2016 El Nino matched 1998 peak and in addition NH after effects lasted longer, followed by the NH warming 2019-20.   An upward bump in 2021 was reversed with temps having returned close to the mean as of 2/2022.  March and April brought warmer Global temps, later reversed.

With the sharp drops in Nov., Dec. and January 2023 temps, there was no increase over 1980. Now in 2023 the buildup to the October peak exceeds the sharp April peak of the El Nino 1998 event. It also surpasses the February peak in 2016.  Where it goes from here, up or down, remains to be seen.

The graph reminds of another chart showing the abrupt ejection of humid air from Hunga Tonga eruption.

TLTs include mixing above the oceans and probably some influence from nearby more volatile land temps.  Clearly NH and Global land temps have been dropping in a seesaw pattern, nearly 1C lower than the 2016 peak.  Since the ocean has 1000 times the heat capacity as the atmosphere, that cooling is a significant driving force.  TLT measures started the recent cooling later than SSTs from HadSST3, but are now showing the same pattern. Despite the three El Ninos, their warming has not persisted prior to 2023, and without them it would probably have cooled since 1995.  Of course, the future has not yet been written.