
RAPID Array measuring North Atlantic SSTs.
For the last few years, observers have been speculating about when the North Atlantic will start the next phase shift from warm to cold.

Source: Energy and Education Canada
An example is this report in May 2015 The Atlantic is entering a cool phase that will change the world’s weather by Gerald McCarthy and Evan Haigh of the RAPID Atlantic monitoring project. Excerpts in italics with my bolds.
This is known as the Atlantic Multidecadal Oscillation (AMO), and the transition between its positive and negative phases can be very rapid. For example, Atlantic temperatures declined by 0.1ºC per decade from the 1940s to the 1970s. By comparison, global surface warming is estimated at 0.5ºC per century – a rate twice as slow.
In many parts of the world, the AMO has been linked with decade-long temperature and rainfall trends. Certainly – and perhaps obviously – the mean temperature of islands downwind of the Atlantic such as Britain and Ireland show almost exactly the same temperature fluctuations as the AMO.
Atlantic oscillations are associated with the frequency of hurricanes and droughts. When the AMO is in the warm phase, there are more hurricanes in the Atlantic and droughts in the US Midwest tend to be more frequent and prolonged. In the Pacific Northwest, a positive AMO leads to more rainfall.
A negative AMO (cooler ocean) is associated with reduced rainfall in the vulnerable Sahel region of Africa. The prolonged negative AMO was associated with the infamous Ethiopian famine in the mid-1980s. In the UK it tends to mean reduced summer rainfall – the mythical “barbeque summer”.Our results show that ocean circulation responds to the first mode of Atlantic atmospheric forcing, the North Atlantic Oscillation, through circulation changes between the subtropical and subpolar gyres – the intergyre region. This a major influence on the wind patterns and the heat transferred between the atmosphere and ocean.
The observations that we do have of the Atlantic overturning circulation over the past ten years show that it is declining. As a result, we expect the AMO is moving to a negative (colder surface waters) phase. This is consistent with observations of temperature in the North Atlantic.
Cold “blobs” in North Atlantic have been reported, but they are usually a winter phenomena. For example in April 2016, the sst anomalies looked like this

But by September, the picture changed to this

And we know from Kaplan AMO dataset, that 2016 summer SSTs were right up there with 1998 and 2010 as the highest recorded.
As the graph above suggests, this body of water is also important for tropical cyclones, since warmer water provides more energy. But those are annual averages, and I am interested in the summer pulses of warm water into the Arctic. As I have noted in my monthly HadSST3 reports, most summers since 2003 there have been warm pulses in the north atlantic.
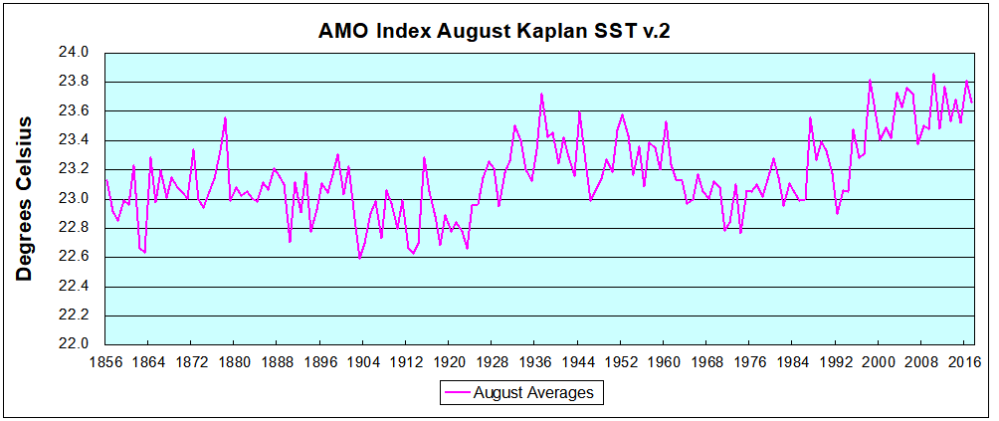 The AMO Index is from from Kaplan SST v2, the unaltered and untrended dataset. By definition, the data are monthly average SSTs interpolated to a 5×5 grid over the North Atlantic basically 0 to 70N. The graph shows warming began after 1992 up to 1998, with a series of matching years since. Because McCarthy refers to hints of cooling to come in the N. Atlantic, let’s take a closer look at some AMO years in the last 2 decades.

This graph shows monthly AMO temps for some important years. The Peak years were 1998, 2010 and 2016, with the latter emphasized as the most recent. The other years show lesser warming, with 2007 emphasized as the coolest in the last 20 years. Note the red 2018 line is at the bottom of all these tracks. Most recently June 2018 is 0.4C lower than June 2016.
With all the talk of AMOC slowing down and a phase shift in the North Atlantic, we await SST measurements for July, August and September to confirm if cooling is starting to set in.

The other day Judith Curry put a 2010 paper by Carl Wunsch – Towards Understanding the Paleocean – out for discussion: https://judithcurry.com/2018/07/22/the-perils-of-near-tabloid-science/, which includes the remarkable statement:
“Myriad hypotheses have been put forward as rationalizing some elements of the oceanic role in
influencing climate–ranging over essentially all possible time scales out to the age of the ocean.
One cannot begin to discuss all of these, and so I will here take as a not-untypical example,
the hypothesis that the North Atlantic circulation largely controls the climate system, and in
particular, the notion that the surface salinity is the determining influence.”
Having a ‘heat-wave” in Northern Europe, I wonder whether meteorology wonders about a link to a colder North Atlantic.
All the best ab
LikeLike
Arnd, good to hear from you. I know you are critical of the AMOC “conveyor belt” notion, and have studied a lot the North Atlantic, including human influences through commercial and military maritme activities. I did note McCarthy linked cooler N. Atlantic SSTs with reduced rain (and clouds?) in UK, resulting in “BBQ summers.”
LikeLike
Further to the “conveyor belt” notion, Carl Wunsch has this to say (my bolds):
“Broecker (1991, and many other papers), building on a sketch of Gordon (1986), reduced the discussion of the Paleocean circulation to that of a one-dimensional ribbon that he called the “great global conveyor.” Its rendering in color cartoon form in Natural History magazine has captured the imagination of a generation of scientists and non-technical writers alike. It is a vivid example of the power of a great graphic, having been used in at least two Hollywood films, and has found its way into essentially every existing textbook on climate, including those at a very elementary level. It is thus now a “fact” of oceanography and climate. (Broecker, 1991, himself originally referred to it as a “logo,” and it would have been well to retain that label).”
“I have written elsewhere (Wunsch, 2002) about the long-list of ways in which the ribbon contradicts known ocean physics. Most insidious, however, is the implication, from its wide acceptance, that the ocean circulation is intrinsically so simple that one can predict its behavior from what a one-dimensional ribbon flow would do. Rather than repeat that earlier discussion, let me confine myself here to three recent examples of the way in which the complexity of the actual circulation is qualitatively at odds with the ribbon picture.”
“One might argue that the ribbon is a useful simplification employed mainly as a framework for discussing complex proxy data. The idea that the ocean transports mass, enthalpy, etc. around the world ocean is indeed incontrovertible, as is the inference that heat, in particular, is “conveyed” from the tropics to high latitudes. But when the cartoon (the logo) becomes a substitute for the reality, and is no longer the subject of questions and tests, it is time to raise the alarm. For example, one eminent, and sophisticated, meteorologist once assured me that global ocean observations were unnecessary as keeping track of the entire system could be done very simply and cheaply with expendable bathythermograph data in the North Atlantic, high latitude, branch of the “conveyor”. The large field programs now underway, intended to measure primarily the North Atlantic circulation, are a direct consequence of this notion, and the conviction that this ribbon flow is reality, has clearly led to the extreme emphasis on supposed control of global climate by the North Atlantic Ocean.”
Click to access wunsch_2010_qsr_modern_paleocean.pdf
LikeLike
Hi Ron – thanks a lot for any support in ocean matters, and indeed I’m a fan on North Atlantic’s influence on weather and climate.
However, when Carl Wunsch merely raise “the hypothesis that the North Atlantic circulation largely controls the climate system”, I’m a bit surprised. Due to many specific NA conditions, it is presumably one of the most influential ocean region, but by all means any square-mile of ocean space – from Pole to Pole – plays a big role in atmospheric behavior.
Let me recall your notion: “For example, Atlantic temperatures declined by 0.1ºC per decade from the 1940s to the 1970s.”, which points to the fact that the only substantial global cooling since the LIA correlated with start and length of naval war during World War II. Warfare definitely has had a huge impact on the sea surface layer from the Baltic to Cape Cod MA regarding heat and salinity structure.
AND the collection of weather data during the war (1939-1945) was abundantly, so that it is possible to investigate thoroughly, whether man was responsible for the global cooling from 1940 to the 1970s. It would be a big tool for “skeptics” to opposed the mainstream AGW thesis.
But as the summer is in full swing, let’s enjoy our wonderful – well temperate – climate.
Best regards ab
LikeLike
Reblogged this on Climate Collections.
LikeLike