
Blaming global warming on humans comes down to two assertions:
Rising CO2 in the atmosphere causes earth’s surface temperature to rise.
Humans burning fossil fuels cause rising atmospheric CO2.
For this post I will not address the first premise, instead refer the reader to a previous article referencing Fred Singer. He noted that greenhouse gas theory presumes surface warming arises because heat is forced to escape at a higher, colder altitude. In fact, temperatures in the tropopause do not change with altitude (“pause”), and in the stratosphere temperatures increase with altitude. That post also includes the “meat” of the brief submitted to Judge Alsup’s court by Happer, Koonin and Lindzen, which questions CO2 driving global warming in the face of other more powerful factors. See Courtroom Climate Science
The focus in this piece is the claim that fossil fuel emissions drive observed rising CO2 concentrations. IPCC consensus scientists and supporters note that human emissions are about twice the measured rise and presume that natural sinks absorb half, leaving the other half to accumulate in the atmosphere. Thus they conclude all of the increase in atmospheric CO2 is from fossil fuels.
This simple-minded conclusion takes the only two things we measure in the carbon cycle: CO2 in the atmosphere, and fossil fuel emissions. And then asserts that one causes the other. But several elephants are in the room, namely the several carbon reservoirs that dwarf human activity in their size and activity, and can not be measured because of their complexity.
The consensus notion is based on a familiar environmental paradigm: The Garden of Eden. This is the modern belief that nature, and indeed the climate is in balance, except for humans disrupting it by their activities. In the current carbon cycle context, it is the supposition that all natural sources and sinks are in balance, thus any additional CO2 is because of humans.
Now, a curious person might wonder: How is it that for decades as the rate of fossil fuel emissions increased, the absorption by natural sinks has also increased at exactly the same rate, so that 50% is always removed and 50% remains? It can only be that nature is also dynamic and its flows change over time!
That alternative paradigm is elaborated in several papers that are currently under vigorous attack from climatists. As one antagonist put it: Any paper concluding that humans don’t cause rising CO2 is obviously wrong. One objectionable study was published by Hermann Harde, another by Ole Humlum, and a third by Ed Berry is delayed in pre-publication review.
The methods and analyses are different, but the three skeptical papers argue that the levels and flows of various carbon reservoirs fluctuate over time with temperature itself as a causal variable. Some sinks are stimulated by higher temperatures to release more CO2 while others respond by capturing more CO2. And these reactions occur on a range of timescales. Once these dynamics are factored in, the human contribution to rising atmospheric CO2 is neglible, much to the ire of alarmists.
Ed Berry finds IPCC carbon cycle metrics illogical.
Dr. Ed Berry provides a preprint of his submitted paper at a blog post entitled Why human CO2 does not change climate. He welcomes comments and uses the discussion to revise and improve the text. Excerpts with my bolds.
The United Nations Intergovernmental Panel on Climate Change (IPCC) claims human emissions raised the carbon dioxide level from 280 ppm to 410 ppm, or 130 ppm. Physics proves this claim is impossible.

The IPCC agrees today’s annual human carbon dioxide emissions are 4.5 ppm per year and nature’s carbon dioxide emissions are 98 ppm per year. Yet, the IPCC claims human emissions have caused all the increase in carbon dioxide since 1750, which is 30 percent of today’s total.
How can human carbon dioxide, which is only 5 percent of natural carbon dioxide, add 30 percent to the level of atmospheric carbon dioxide? It can’t.

This paper derives a Model that shows how human and natural carbon dioxide emissions independently change the equilibrium level of atmospheric carbon dioxide. This Model should replace the IPCC’s invalid Bern model.
The Model shows the ratio of human to natural carbon dioxide in the atmosphere equals the ratio of their inflows, independent of residence time.

Fig. 5. The sum of nature’s inflow is 20 times larger than the sum of human emissions. Nature balances inflow with or without human emissions.
The model shows, contrary to IPCC claims, that human emissions do not continually add carbon dioxide to the atmosphere, but rather cause a flow of carbon dioxide through the atmosphere. The flow adds a constant equilibrium level, not a continuing increasing level, of carbon dioxide.

Fig. 2. Balance proceeds as follows: (1) Inflow sets the balance level. (2) Level sets the outflow. (3) Level moves toward balance level until outflow equals inflow.
Ole Humlum proves that CO2 follows temperature also for interannual/decadal periods.
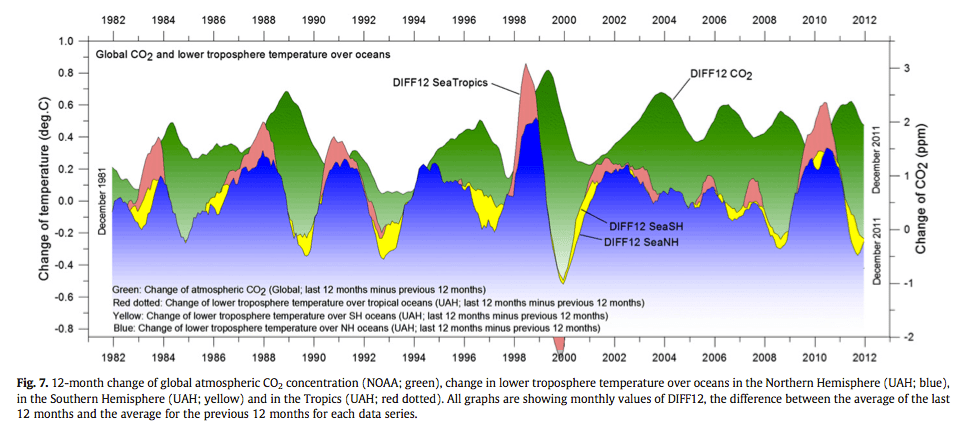
Humlum et al. looks the modern record of fluctuating temperatures and atmospheric CO2 and concludes that CO2 changes follow temperature changes over these timescales. The paper is The phase relation between atmospheric carbon dioxide and global temperature OleHumlum, KjellStordahl, Jan-ErikSolheim. Excerpts with my bolds.
From the Abstract:
Using data series on atmospheric carbon dioxide and global temperatures we investigate the phase relation (leads/lags) between these for the period January 1980 to December 2011. Ice cores show atmospheric CO2 variations to lag behind atmospheric temperature changes on a century to millennium scale, but modern temperature is expected to lag changes in atmospheric CO2, as the atmospheric temperature increase since about 1975 generally is assumed to be caused by the modern increase in CO2.
In our analysis we used eight well-known datasets. . . We find a high degree of co-variation between all data series except 7) and 8), but with changes in CO2 always lagging changes in temperature.
 Highlights
► Changes in global atmospheric CO2 are lagging 11–12 months behind changes in global sea surface temperature. ► Changes in global atmospheric CO2 are lagging 9.5–10 months behind changes in global air surface temperature. ► Changes in global atmospheric CO2 are lagging about 9 months behind changes in global lower troposphere temperature. ► Changes in ocean temperatures explain a substantial part of the observed changes in atmospheric CO2 since January 1980. ► Changes in atmospheric CO2 are not tracking changes in human emissions.
Summary
Summing up, monthly data since January 1980 on atmospheric CO2 and sea and air temperatures unambiguously demonstrate the overall global temperature change sequence of events to be 1) ocean surface, 2) surface air, 3) lower troposphere, and with changes in atmospheric CO2 always lagging behind changes in any of these different temperature records.9
A main control on atmospheric CO2 appears to be the ocean surface temperature, and it remains a possibility that a significant part of the overall increase of atmospheric CO2 since at least 1958 (start of Mauna Loa observations) simply reflects the gradual warming of the oceans, as a result of the prolonged period of high solar activity since 1920 (Solanki et al., 2004).
Based on the GISP2 ice core proxy record from Greenland it has previously been pointed out that the present period of warming since 1850 to a high degree may be explained by a natural c. 1100 yr periodic temperature variation (Humlum et al., 2011).
Hermann Harde sets realistic proportions for the carbon cycle.
Hermann Harde applies a comparable perspective to consider the carbon cycle dynamics. His paper is Scrutinizing the carbon cycle and CO2 residence time in the atmosphere. Excerpts with my bolds.

From the Abstract:
Climate scientists presume that the carbon cycle has come out of balance due to the increasing anthropogenic emissions from fossil fuel combustion and land use change. This is made responsible for the rapidly increasing atmospheric CO2 concentrations over recent years, and it is estimated that the removal of the additional emissions from the atmosphere will take a few hundred thousand years. Since this goes along with an increasing greenhouse effect and a further global warming, a better understanding of the carbon cycle is of great importance for all future climate change predictions. We have critically scrutinized this cycle and present an alternative concept, for which the uptake of CO2 by natural sinks scales proportional with the CO2 concentration. In addition, we consider temperature dependent natural emission and absorption rates, by which the paleoclimatic CO2 variations and the actual CO2 growth rate can well be explained. The anthropogenic contribution to the actual CO2 concentration is found to be 4.3%, its fraction to the CO2 increase over the Industrial Era is 15% and the average residence time 4 years.
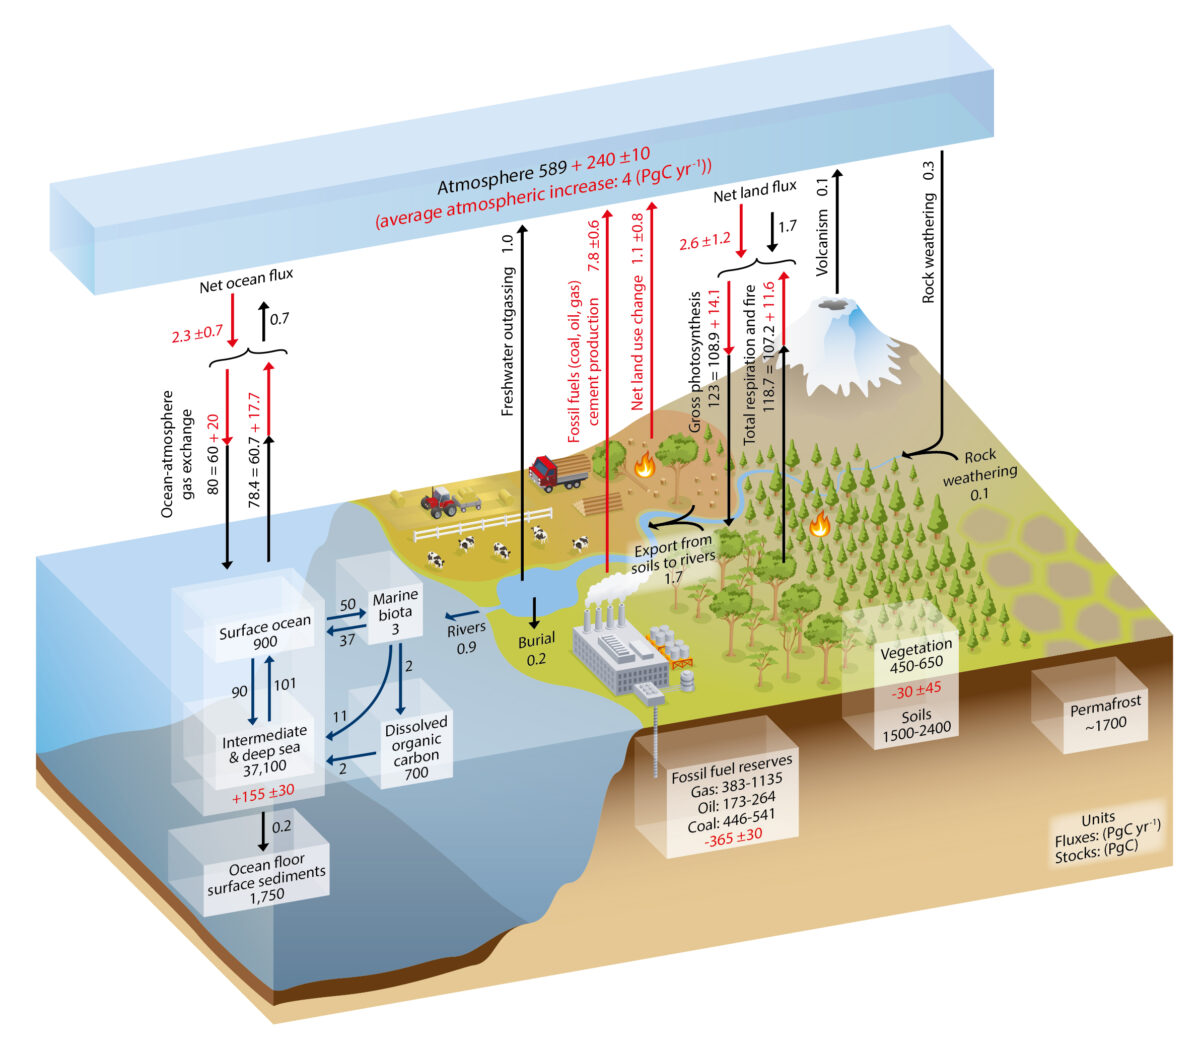 Fig. 1. Simplified schematic of the global carbon cycle. Black numbers and arrows indicate reservoir mass in PgC and exchange fluxes in PgC/yr before the Industrial Era. Red arrows and numbers show annual anthropogenic’ flux changes averaged over the 2000–2009 time period. Graphic from AR5-Chap.6-Fig.6.1.
Conclusions
Climate scientists assume that a disturbed carbon cycle, which has come out of balance by the increasing anthropogenic emissions from fossil fuel combustion and land use change, is responsible for the rapidly increasing atmospheric CO2 concentrations over recent years. While over the whole Holocene up to the entrance of the Industrial Era (1750) natural emissions by heterotrophic processes and fire were supposed to be in equilibrium with the uptake by photosynthesis and the net ocean-atmosphere gas exchange, with the onset of the Industrial Era the IPCC estimates that about 15–40% of the additional emissions cannot further be absorbed by the natural sinks and are accumulating in the atmosphere. The IPCC further argues that CO2 emitted until 2100 will remain in the atmosphere longer than 1000 years, and in the same context it is even mentioned that the removal of human-emitted CO2 from the atmosphere by natural processes will take a few hundred thousand years (high confidence) (see AR5-Chap.6ExecutiveSummary). Since the rising CO2 concentrations go along with an increasing greenhouse effect and, thus, a further global warming, a better understanding of the carbon cycle is a necessary prerequisite for all future climate change predictions.
In their accounting schemes and models of the carbon cycle the IPCC uses many new and detailed data which are primarily focussing on fossil fuel emission, cement fabrication or net land use change (see AR5-WG1- Chap.6.3.2), but it largely neglects any changes of the natural emissions, which contribute to more than 95 % to the total emissions and by far cannot be assumed to be constant over longer periods (see, e.g.: variations over the last 800,000 years (Jouzel et al., 2007); the last glacial termination (Monnin et al., 2001); or the younger Holocene (Monnin et al., 2004; Wagner et al., 2004)).
Since our own estimates of the average CO2 residence time in the atmosphere differ by several orders of magnitude from the announced IPCC values, and on the other hand actual investigations of Humlum et al. (2013) or Salby (2013, 2016) show a strong relation between the natural CO2 emission rate and the surface temperature, this was motivation enough to scrutinize the IPCC accounting scheme in more detail and to contrast this to our own calculations.
Different to the IPCC we start with a rate equation for the emission and absorption processes, where the uptake is not assumed to be saturated but scales proportional with the actual CO2 concentration in the atmosphere (see also Essenhigh, 2009; Salby, 2016). This is justified by the observation of an exponential decay of 14C. A fractional saturation, as assumed by the IPCC, can directly be expressed by a larger residence time of CO2 in the atmosphere and makes a distinction between a turnover time and adjustment time needless.
Based on this approach and as solution of the rate equation we derive a concentration at steady state, which is only determined by the product of the total emission rate and the residence time. Under present conditions the natural emissions contribute 373 ppm and anthropogenic emissions 17 ppm to the total concentration of 390 ppm (2012). For the average residence time we only find 4 years.
The stronger increase of the concentration over the Industrial Era up to present times can be explained by introducing a temperature dependent natural emission rate as well as a temperature affected residence time. With this approach not only the exponential increase with the onset of the Industrial Era but also the concentrations at glacial and cooler interglacial times can well be reproduced in full agreement with all observations.
So, different to the IPCC’s interpretation the steep increase of the concentration since 1850 finds its natural explanation in the self accelerating processes on the one hand by stronger degassing of the oceans as well as a faster plant growth and decomposition, on the other hand by an increasing residence time at reduced solubility of CO2 in oceans. Together this results in a dominating temperature controlled natural gain, which contributes about 85% to the 110 ppm CO2 increase over the Industrial Era, whereas the actual anthropogenic emissions of 4.3% only donate 15%. These results indicate that almost all of the observed change of CO2 during the Industrial Era followed, not from anthropogenic emission, but from changes of natural emission. The results are consistent with the observed lag of CO2 changes behind temperature changes (Humlum et al., 2013; Salby, 2013), a signature of cause and effect. Our analysis of the carbon cycle, which exclusively uses data for the CO2 concentrations and fluxes as published in AR5, shows that also a completely different interpretation of these data is possible, this in complete conformity with all observations and natural causalities.
Background


Reblogged this on Tallbloke's Talkshop and commented:
As Dr Ed Berry says: ‘How can human carbon dioxide, which is only 5 percent of natural carbon dioxide, add 30 percent to the level of atmospheric carbon dioxide? It can’t.’
LikeLiked by 1 person
Hmmm….
A necessary consequence of this would be that upon entry into a new Glacial period, atmospheric CO2 stripping by very cold precipitation would happen and this CO2 would accumulate in the oceans. That, then, would result in lower atmospheric CO2 levels leading to lower crop productivity. (The approx. 25% gain from more CO2 would be lost).
The implication of that for global famine and political instability rather stark.
One hopes we continue to warm for some time as the consequences of cooling look to be dire.
LikeLike
E.M. thanks for reblogging this. Agree that cooling in the future is not preferable to continued mild conditions. It s only virtue is to expose warmism as a false belief.
LikeLike
Reblogged this on Climate Collections.
LikeLike
The drop in ocean temperature in the tropics increases the absorption of CO2 by diatoms.


LikeLike
Sorry.
https://earth.nullschool.net/#current/chem/surface/level/overlay=co2sc/equirectangular
LikeLike
ren, I am not familiar with this “chem” image from nullschool. Can you explain what it means?
LikeLike
https://earth.nullschool.net/about.html
From 2017-01-24 04:30 UTC, this adjustment is no longer necessary because GEOS-5 appears to have been upgraded.
While implementing the visualization of CO2 surface concentration, I noticed the NASA GEOS-5 model reports a global mean concentration that differs significantly from widely reported numbers. For example, from the run at 2015-11-23 00:00 UTC, the global mean is only 368 ppmv whereas CO2 observatories report concentrations closer to 400 ppmv. GEOS-5 was constructed in the 2000s, so perhaps the model does not account for accumulation of atmospheric CO2 over time? This is simply speculation. I am just not certain.
To bring the GEOS-5 results closer to contemporary numbers, I have added a uniform offset of +32 ppmv, increasing the global mean to 400 ppmv. This is not scientifically valid, but it does allow the visualization to become illustrative of the discussion occurring today around atmospheric CO2. Without question, I would welcome a more rigorous approach or an explanation why the GEOS-5 model produces the data that it does.
LikeLike
One thing’s for certain, life as we know it cannot endure many more ice ages bringing CO2 down to nearly an extinction level. And as I see it, any concentration of CO2 below about 1000ppm is denying most plants as much food as they would otherwise absorb. So, if we actually could control CO2, (which we cannot), I vote for a concentration of 1500 which might be enough to preclude another ice age as well!
LikeLike
IF greenhouse gases trap heat why do NASA show that the level of radiation to space as recorded by satellites has been increasing over the period from 1979 – 2004 and show a positive anomaly for almost the whole period ?
https://earthobservatory.nasa.gov/Features/Nimbus/nimbus2.php
Why, if you have data from 1964 – 2004, do NASA only show the period from 1979 ?
Are you suspicious of the whole unproven hypothesis as I am ?
LikeLike
Reblogged this on Abacus.
LikeLike
Hello Ron Clutz and thank you for your work on this website.
My January 2008 icecap.us paper predates Humlum et al (2013) by 5 years and shows the close relationship of dCO2/dt vs global temperature that drives the ~9-month lag of CO2 trends AFTER temperature trends. A further update is here, and this ties it all together:
https://wattsupwiththat.com/2018/06/open-thread-trying-out-a-new-comment-system/#comment-2370202
LikeLike
Reblogged this on Climate- Science.
LikeLike